HSBC 2011 Annual Report Download - page 320
Download and view the complete annual report
Please find page 320 of the 2011 HSBC annual report below. You can navigate through the pages in the report by either clicking on the pages listed below, or by using the keyword search tool below to find specific information within the annual report.-
 1
1 -
2
-
3
-
4
-
5
-
6
-
7
-
8
-
9
-
10
-
11
-
12
-
13
-
14
-
15
-
16
-
17
-
18
-
19
-
20
-
21
-
22
-
23
-
24
-
25
-
26
-
27
-
28
-
29
-
30
-
31
-
32
-
33
-
34
-
35
-
36
-
37
-
38
-
39
-
40
-
41
-
42
-
43
-
44
-
45
-
46
-
47
-
48
-
49
-
50
-
51
-
52
-
53
-
54
-
55
-
56
-
57
-
58
-
59
-
60
-
61
-
62
-
63
-
64
-
65
-
66
-
67
-
68
-
69
-
70
-
71
-
72
-
73
-
74
-
75
-
76
-
77
-
78
-
79
-
80
-
81
-
82
-
83
-
84
-
85
-
86
-
87
-
88
-
89
-
90
-
91
-
92
-
93
-
94
-
95
-
96
-
97
-
98
-
99
-
100
-
101
-
102
-
103
-
104
-
105
-
106
-
107
-
108
-
109
-
110
-
111
-
112
-
113
-
114
-
115
-
116
-
117
-
118
-
119
-
120
-
121
-
122
-
123
-
124
-
125
-
126
-
127
-
128
-
129
-
130
-
131
-
132
-
133
-
134
-
135
-
136
-
137
-
138
-
139
-
140
-
141
-
142
-
143
-
144
-
145
-
146
-
147
-
148
-
149
-
150
-
151
-
152
-
153
-
154
-
155
-
156
-
157
-
158
-
159
-
160
-
161
-
162
-
163
-
164
-
165
-
166
-
167
-
168
-
169
-
170
-
171
-
172
-
173
-
174
-
175
-
176
-
177
-
178
-
179
-
180
-
181
-
182
-
183
-
184
-
185
-
186
-
187
-
188
-
189
-
190
-
191
-
192
-
193
-
194
-
195
-
196
-
197
-
198
-
199
-
200
-
201
-
202
-
203
-
204
-
205
-
206
-
207
-
208
-
209
-
210
-
211
-
212
-
213
-
214
-
215
-
216
-
217
-
218
-
219
-
220
-
221
-
222
-
223
-
224
-
225
-
226
-
227
-
228
-
229
-
230
-
231
-
232
-
233
-
234
-
235
-
236
-
237
-
238
-
239
-
240
-
241
-
242
-
243
-
244
-
245
-
246
-
247
-
248
-
249
-
250
-
251
-
252
-
253
-
254
-
255
-
256
-
257
-
258
-
259
-
260
-
261
-
262
-
263
-
264
-
265
-
266
-
267
-
268
-
269
-
270
-
271
-
272
-
273
-
274
-
275
-
276
-
277
-
278
-
279
-
280
-
281
-
282
-
283
-
284
-
285
-
286
-
287
-
288
-
289
-
290
-
291
-
292
-
293
-
294
-
295
-
296
-
297
-
298
-
299
-
300
-
301
-
302
-
303
-
304
-
305
-
306
-
307
-
308
-
309
-
 310
310 -
 311
311 -
 312
312 -
 313
313 -
 314
314 -
 315
315 -
 316
316 -
 317
317 -
 318
318 -
 319
319 -
 320
320 -
 321
321 -
 322
322 -
 323
323 -
 324
324 -
 325
325 -
 326
326 -
 327
327 -
 328
328 -
 329
329 -
 330
330 -
331
-
332
-
333
-
334
-
335
-
336
-
337
-
338
-
339
-
340
-
341
-
342
-
343
-
344
-
345
-
346
-
347
-
348
-
349
-
350
-
351
-
352
-
353
-
354
-
355
-
356
-
357
-
358
-
359
-
360
-
361
-
362
-
363
-
364
-
365
-
366
-
367
-
368
-
369
-
370
-
371
-
372
-
373
-
374
-
375
-
376
-
377
-
378
-
379
-
380
-
381
-
382
-
383
-
384
-
385
-
386
-
387
-
388
-
389
-
390
-
391
-
392
-
393
-
394
-
395
-
396
-
397
-
398
-
399
-
400
-
401
-
402
-
403
-
404
-
405
-
406
-
407
-
408
-
409
-
410
-
411
-
412
-
413
-
414
-
415
-
416
-
417
-
418
-
419
-
420
-
421
-
422
-
423
-
424
-
425
-
426
-
427
-
428
-
429
-
430
-
431
-
432
-
433
-
434
-
435
-
436
-
437
-
438
-
439
-
440
 |
 |
HSBC HOLDINGS PLC
Notes on the Financial Statements (continued)
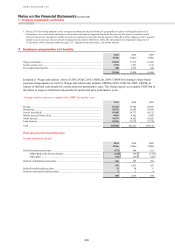
7 – Employee compensation and benefits
318
Pension plans in the UK
The largest plan exists in the UK, where the HSBC Bank (UK) Pension Scheme (‘the Scheme’) covers employees of
HSBC Bank plc and certain other employees of HSBC. This comprises a funded defined benefit plan (‘the principal
plan’), which is closed to new entrants, and a defined contribution plan which was established in July 1996 for new
employees.
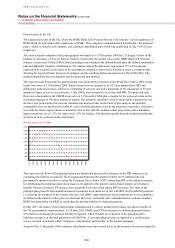
The latest actuarial valuation of the principal plan was made as at 31 December 2008 by C G Singer, Fellow of the
Institute of Actuaries, of Towers Watson Limited. At that date, the market value of the HSBC Bank (UK) Pension
Scheme’s assets was £10.6bn (US$15.5bn) (including assets relating to the defined benefit plan, the defined contribution
plan and additional voluntary contributions). The market value of the plan assets represented 77% of the amount
expected to be required, on the basis of the assumptions adopted, to provide the benefits accrued to members after
allowing for expected future increases in earnings, and the resulting deficit amounted to £3.2bn (US$4.7bn). The
method adopted for this investigation was the projected unit method.
The expected cash flows from the principal plan were projected by reference to the Retail Price Index (‘RPI’) swap
break-even curve at 31 December 2008. Salary increases were assumed to be 0.5% per annum above RPI and
inflationary pension increases, subject to a minimum of zero per cent and a maximum of 5% (maximum of 3% per
annum in respect of service accrued since 1 July 2009), were assumed to be in line with RPI. The projected cash
flows were discounted at the LIBOR swap curve at 31 December 2008 plus a margin for the expected return on the
investment strategy of 190 basis points per annum. The mortality experience of the principal plan’s pensioners over
the three year period since the previous valuation was analysed and, on the basis of this analysis, the mortality
assumptions were set based on the SAPS S1 series of tables adjusted to best fit the pensioner experience. Allowance
was made for future improvements to mortality rates in line with the medium cohort projections with a minimum
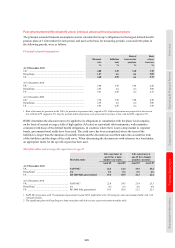
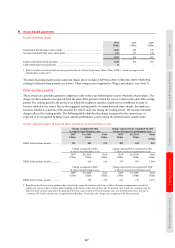
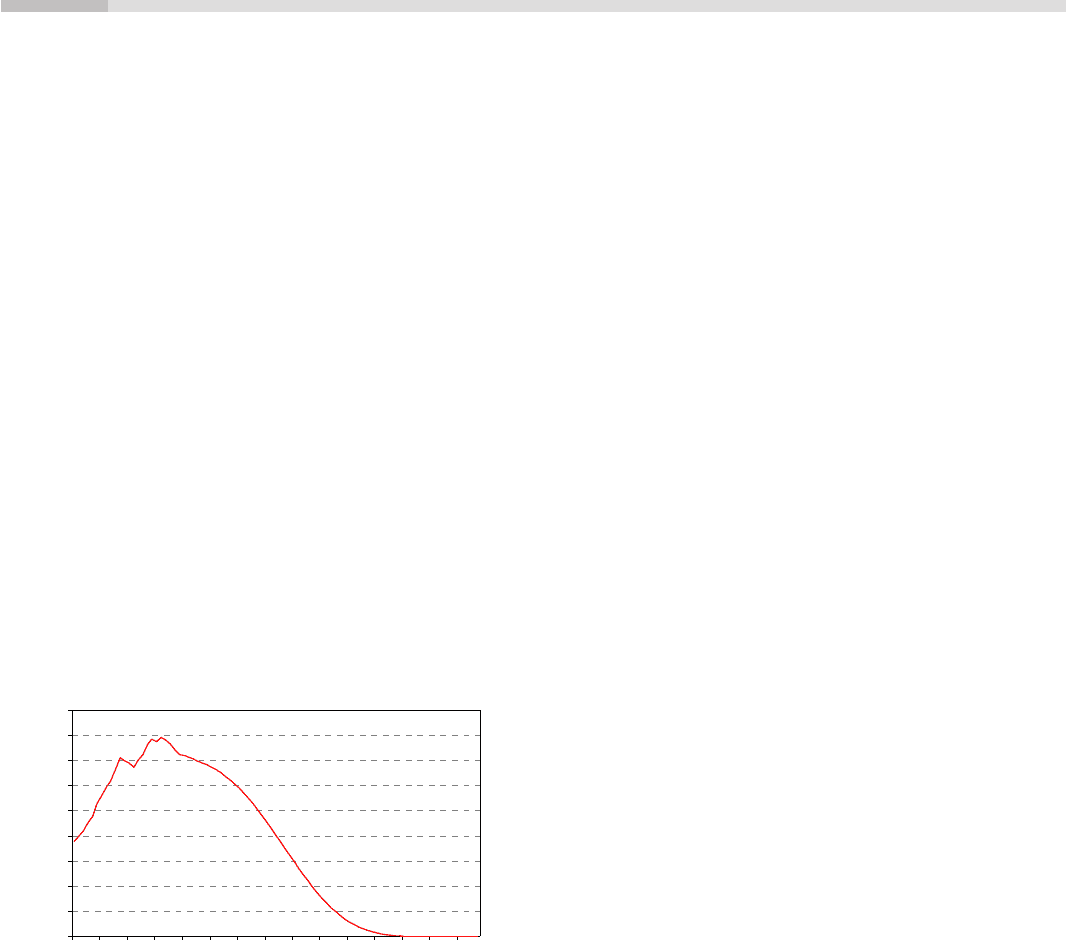
improvement rate set at 1.75% for males and 1.25% for females. The benefits payable from the defined benefit plan
are forecast to be as shown in the chart below.
Benefit payments (US$m)
0
200
400
600
800
1,000
1,200
1,400
1,600
1,800
2012
2018
2024
2030
2036
2042
2048
2054
2060
2066
2072
2078
2084
2090
2096
The expected cash flows of the principal plan were historically projected by reference to the RPI swap curve in
calculating the liability recognised. The Occupational Pensions (Revaluation) Order 2010 confirmed the UK
government's intention to move to using the Consumer Prices Index (‘CPI’) rather than RPI as the inflation measure
for determining the minimum pension increases to be applied to the statutory index-linked features of retirement
benefits. Historical annual CPI increases have generally been lower than annual RPI increases. The rules of the
principal plan prescribe that annual increases for pensions in payment are in line with RPI, but for deferred pensions,
i.e. pensions for members of the scheme who have left HSBC employment but whose pensions are yet to commence,
are linked to the statutory index prior to retirement. However, consistent with communications to scheme members,
HSBC has historically used RPI in calculating the pension liability for deferred pensions.
In May 2011, the trustee of the principal plan communicated to scheme members the impact on scheme benefits of
the UK government’s announcement. At 30 June 2011, HSBC used CPI for increases to deferred pensions before
retirement in calculating the pension liability recognised, which resulted in a reduction of the principal plan’s
liabilities in respect of deferred pensioners of US$587m. A corresponding gain was recognised as a credit to past
service cost and is included within ‘Employee compensation and benefits’ in the income statement.
As part of the 31 December 2008 valuation, calculations were also carried out as to the amount of assets that might be