HSBC 2011 Annual Report Download - page 26
Download and view the complete annual report
Please find page 26 of the 2011 HSBC annual report below. You can navigate through the pages in the report by either clicking on the pages listed below, or by using the keyword search tool below to find specific information within the annual report.-
 1
1 -
2
-
3
-
4
-
5
-
6
-
7
-
8
-
9
-
10
-
11
-
12
-
13
-
14
-
15
-
 16
16 -
 17
17 -
 18
18 -
 19
19 -
 20
20 -
 21
21 -
 22
22 -
 23
23 -
 24
24 -
 25
25 -
 26
26 -
 27
27 -
 28
28 -
 29
29 -
 30
30 -
 31
31 -
 32
32 -
 33
33 -
 34
34 -
 35
35 -
 36
36 -
37
-
38
-
39
-
40
-
41
-
42
-
43
-
44
-
45
-
46
-
47
-
48
-
49
-
50
-
51
-
52
-
53
-
54
-
55
-
56
-
57
-
58
-
59
-
60
-
61
-
62
-
63
-
64
-
65
-
66
-
67
-
68
-
69
-
70
-
71
-
72
-
73
-
74
-
75
-
76
-
77
-
78
-
79
-
80
-
81
-
82
-
83
-
84
-
85
-
86
-
87
-
88
-
89
-
90
-
91
-
92
-
93
-
94
-
95
-
96
-
97
-
98
-
99
-
100
-
101
-
102
-
103
-
104
-
105
-
106
-
107
-
108
-
109
-
110
-
111
-
112
-
113
-
114
-
115
-
116
-
117
-
118
-
119
-
120
-
121
-
122
-
123
-
124
-
125
-
126
-
127
-
128
-
129
-
130
-
131
-
132
-
133
-
134
-
135
-
136
-
137
-
138
-
139
-
140
-
141
-
142
-
143
-
144
-
145
-
146
-
147
-
148
-
149
-
150
-
151
-
152
-
153
-
154
-
155
-
156
-
157
-
158
-
159
-
160
-
161
-
162
-
163
-
164
-
165
-
166
-
167
-
168
-
169
-
170
-
171
-
172
-
173
-
174
-
175
-
176
-
177
-
178
-
179
-
180
-
181
-
182
-
183
-
184
-
185
-
186
-
187
-
188
-
189
-
190
-
191
-
192
-
193
-
194
-
195
-
196
-
197
-
198
-
199
-
200
-
201
-
202
-
203
-
204
-
205
-
206
-
207
-
208
-
209
-
210
-
211
-
212
-
213
-
214
-
215
-
216
-
217
-
218
-
219
-
220
-
221
-
222
-
223
-
224
-
225
-
226
-
227
-
228
-
229
-
230
-
231
-
232
-
233
-
234
-
235
-
236
-
237
-
238
-
239
-
240
-
241
-
242
-
243
-
244
-
245
-
246
-
247
-
248
-
249
-
250
-
251
-
252
-
253
-
254
-
255
-
256
-
257
-
258
-
259
-
260
-
261
-
262
-
263
-
264
-
265
-
266
-
267
-
268
-
269
-
270
-
271
-
272
-
273
-
274
-
275
-
276
-
277
-
278
-
279
-
280
-
281
-
282
-
283
-
284
-
285
-
286
-
287
-
288
-
289
-
290
-
291
-
292
-
293
-
294
-
295
-
296
-
297
-
298
-
299
-
300
-
301
-
302
-
303
-
304
-
305
-
306
-
307
-
308
-
309
-
310
-
311
-
312
-
313
-
314
-
315
-
316
-
317
-
318
-
319
-
320
-
321
-
322
-
323
-
324
-
325
-
326
-
327
-
328
-
329
-
330
-
331
-
332
-
333
-
334
-
335
-
336
-
337
-
338
-
339
-
340
-
341
-
342
-
343
-
344
-
345
-
346
-
347
-
348
-
349
-
350
-
351
-
352
-
353
-
354
-
355
-
356
-
357
-
358
-
359
-
360
-
361
-
362
-
363
-
364
-
365
-
366
-
367
-
368
-
369
-
370
-
371
-
372
-
373
-
374
-
375
-
376
-
377
-
378
-
379
-
380
-
381
-
382
-
383
-
384
-
385
-
386
-
387
-
388
-
389
-
390
-
391
-
392
-
393
-
394
-
395
-
396
-
397
-
398
-
399
-
400
-
401
-
402
-
403
-
404
-
405
-
406
-
407
-
408
-
409
-
410
-
411
-
412
-
413
-
414
-
415
-
416
-
417
-
418
-
419
-
420
-
421
-
422
-
423
-
424
-
425
-
426
-
427
-
428
-
429
-
430
-
431
-
432
-
433
-
434
-
435
-
436
-
437
-
438
-
439
-
440
 |
 |

HSBC HOLDINGS PLC
Report of the Directors: Operating and Financial Review (continued)
Financial summary > Group performance
24
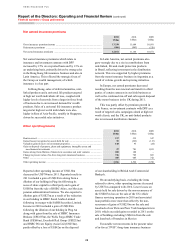
lower adverse fair value movements on these
instruments in Europe.
Ineffectiveness in the hedging of available-for-
sale investment portfolios resulted in adverse
movements on fair value hedges. This was due to
growth in the underlying investment portfolio in
Europe as a result of new purchases and a more
pronounced decline in yield curves in North America
than in 2010.
Net interest income earned on trading activities
rose by 23%, driven by an increase in average
holdings and higher yields on our trading portfolio.
This was partly offset by higher interest expense on
trading liabilities reflecting an increase in funding
requirements in line with the growth in average
trading assets. The cost of internally funding these
assets also rose, but this interest expense is reported
within ‘Net interest income’.
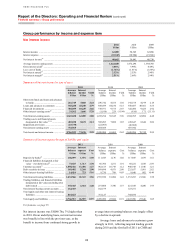
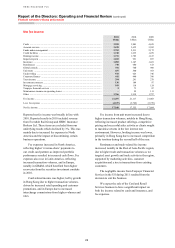
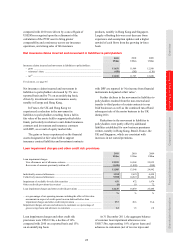
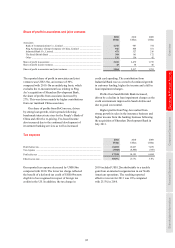
Net income/(expense) from financial instruments designated at fair value
2011
US$m
2010
US$m
2009
US$m
Net income/(expense) arising from:
– financial assets held to meet liabilities under insurance and
investment contracts ........................................................................................... (933) 2,349 3,793
– liabilities to customers under investment contracts ........................................... 231 (946) (1,329)
– HSBC’s long-term debt issued and related derivatives ..................................... 4,161 (258) (6,247)
Change in own credit spread on long-term debt ........................................... 3,933 (63) (6,533)
Other changes in fair value34 ......................................................................... 228 (195) 286
– other instruments designated at fair value and related derivatives .................... (20) 75 252
Net income/(expense) from financial instruments designated at fair value .............. 3,439 1,220 (3,531)
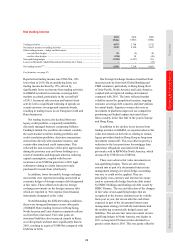
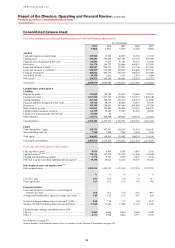
Assets and liabilities from which net income/(expense) from financial instruments designated at fair value arose
2011
US$m
2010
US$m
2009
US$m
Financial assets designated at fair value at 31 December .......................................... 30,856 37,011 37,181
Financial liabilities designated at fair value at 31 December .................................... 85,724 88,133 80,092
Including:
Financial assets held to meet liabilities under:
– insurance contracts and investment contracts with DPF35 .................................. 7,221 7,167 6,097
– unit-linked insurance and other insurance and investment contracts ................. 20,033 19,725 16,982
Long-term debt issues designated at fair value .......................................................... 73,808 69,906 62,641
For footnotes, see page 95.
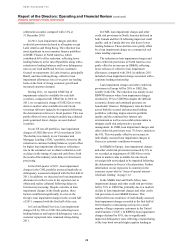
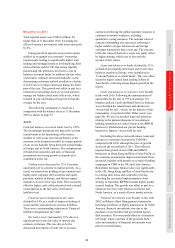
The accounting policies for the designation of
financial instruments at fair value and the treatment
of the associated income and expenses are described
in Notes 2i and 2b on the Financial Statements,
respectively.
The majority of the financial liabilities designated
at fair value relate to certain fixed-rate long-term
debt issues whose rate profile has been changed to
floating through interest rate swaps as part of a
documented interest rate management strategy. The
movement in fair value of these long-term debt
issues includes the effect of our credit spread
changes and any ineffectiveness in the economic
relationship between the related swaps and own debt.
As credit spreads widen or narrow, accounting
profits or losses, respectively, are booked. The size
and direction of the changes in the credit spread on
our debt and ineffectiveness, which are recognised in
the income statement, can be volatile from year to
year, but do not alter the cash flows envisaged as part
of the documented interest rate management strategy.
As a consequence, fair value movements arising
from changes in our own credit spread on long-term
debt and other fair value movements on the debt and
related derivatives are not regarded internally as part
of managed performance and are therefore not
allocated to customer groups, but are reported in
‘Other’. Credit spread movements on own debt are
excluded from underlying results, and related fair
value movements are not included in the calculation
of regulatory capital.
We reported net income from financial
instruments designated at fair value of US$3.4bn
in 2011 compared with US$1.2bn in 2010. This
included the credit spread-related movements in the
fair value of our own long-term debt, on which we
reported favourable fair value movements of
US$3.9bn in 2011 and adverse movements of
US$63m in 2010. These favourable fair value
movements arose in 2011 as credit spreads widened,