HSBC 2011 Annual Report Download - page 352
Download and view the complete annual report
Please find page 352 of the 2011 HSBC annual report below. You can navigate through the pages in the report by either clicking on the pages listed below, or by using the keyword search tool below to find specific information within the annual report.-
 1
1 -
2
-
3
-
4
-
5
-
6
-
7
-
8
-
9
-
10
-
11
-
12
-
13
-
14
-
15
-
16
-
17
-
18
-
19
-
20
-
21
-
22
-
23
-
24
-
25
-
26
-
27
-
28
-
29
-
30
-
31
-
32
-
33
-
34
-
35
-
36
-
37
-
38
-
39
-
40
-
41
-
42
-
43
-
44
-
45
-
46
-
47
-
48
-
49
-
50
-
51
-
52
-
53
-
54
-
55
-
56
-
57
-
58
-
59
-
60
-
61
-
62
-
63
-
64
-
65
-
66
-
67
-
68
-
69
-
70
-
71
-
72
-
73
-
74
-
75
-
76
-
77
-
78
-
79
-
80
-
81
-
82
-
83
-
84
-
85
-
86
-
87
-
88
-
89
-
90
-
91
-
92
-
93
-
94
-
95
-
96
-
97
-
98
-
99
-
100
-
101
-
102
-
103
-
104
-
105
-
106
-
107
-
108
-
109
-
110
-
111
-
112
-
113
-
114
-
115
-
116
-
117
-
118
-
119
-
120
-
121
-
122
-
123
-
124
-
125
-
126
-
127
-
128
-
129
-
130
-
131
-
132
-
133
-
134
-
135
-
136
-
137
-
138
-
139
-
140
-
141
-
142
-
143
-
144
-
145
-
146
-
147
-
148
-
149
-
150
-
151
-
152
-
153
-
154
-
155
-
156
-
157
-
158
-
159
-
160
-
161
-
162
-
163
-
164
-
165
-
166
-
167
-
168
-
169
-
170
-
171
-
172
-
173
-
174
-
175
-
176
-
177
-
178
-
179
-
180
-
181
-
182
-
183
-
184
-
185
-
186
-
187
-
188
-
189
-
190
-
191
-
192
-
193
-
194
-
195
-
196
-
197
-
198
-
199
-
200
-
201
-
202
-
203
-
204
-
205
-
206
-
207
-
208
-
209
-
210
-
211
-
212
-
213
-
214
-
215
-
216
-
217
-
218
-
219
-
220
-
221
-
222
-
223
-
224
-
225
-
226
-
227
-
228
-
229
-
230
-
231
-
232
-
233
-
234
-
235
-
236
-
237
-
238
-
239
-
240
-
241
-
242
-
243
-
244
-
245
-
246
-
247
-
248
-
249
-
250
-
251
-
252
-
253
-
254
-
255
-
256
-
257
-
258
-
259
-
260
-
261
-
262
-
263
-
264
-
265
-
266
-
267
-
268
-
269
-
270
-
271
-
272
-
273
-
274
-
275
-
276
-
277
-
278
-
279
-
280
-
281
-
282
-
283
-
284
-
285
-
286
-
287
-
288
-
289
-
290
-
291
-
292
-
293
-
294
-
295
-
296
-
297
-
298
-
299
-
300
-
301
-
302
-
303
-
304
-
305
-
306
-
307
-
308
-
309
-
310
-
311
-
312
-
313
-
314
-
315
-
316
-
317
-
318
-
319
-
320
-
321
-
322
-
323
-
324
-
325
-
326
-
327
-
328
-
329
-
330
-
331
-
332
-
333
-
334
-
335
-
336
-
337
-
338
-
339
-
340
-
341
-
 342
342 -
 343
343 -
 344
344 -
 345
345 -
 346
346 -
 347
347 -
 348
348 -
 349
349 -
 350
350 -
 351
351 -
 352
352 -
 353
353 -
 354
354 -
 355
355 -
 356
356 -
 357
357 -
 358
358 -
 359
359 -
 360
360 -
 361
361 -
 362
362 -
363
-
364
-
365
-
366
-
367
-
368
-
369
-
370
-
371
-
372
-
373
-
374
-
375
-
376
-
377
-
378
-
379
-
380
-
381
-
382
-
383
-
384
-
385
-
386
-
387
-
388
-
389
-
390
-
391
-
392
-
393
-
394
-
395
-
396
-
397
-
398
-
399
-
400
-
401
-
402
-
403
-
404
-
405
-
406
-
407
-
408
-
409
-
410
-
411
-
412
-
413
-
414
-
415
-
416
-
417
-
418
-
419
-
420
-
421
-
422
-
423
-
424
-
425
-
426
-
427
-
428
-
429
-
430
-
431
-
432
-
433
-
434
-
435
-
436
-
437
-
438
-
439
-
440
 |
 |

HSBC HOLDINGS PLC
Notes on the Financial Statements (continued)
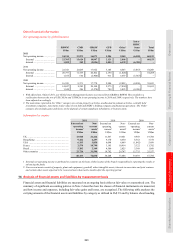
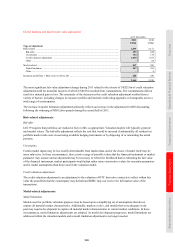
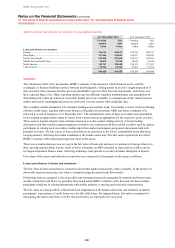
16 – Fair values of financial instruments carried at fair value
350
Inception profit (Day 1 P&L reserves)
Inception profit adjustments are adopted where the fair value estimated by a valuation model is based on one or more
significant unobservable inputs. The accounting for inception profit adjustments is discussed on page 295. An
analysis of the movement in the deferred Day 1 P&L reserve is provided on page 363.
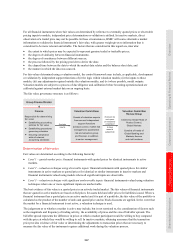
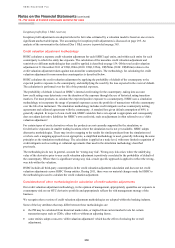
Credit valuation adjustment methodology
HSBC calculates a separate credit valuation adjustment for each HSBC legal entity, and within each entity for each
counterparty to which the entity has exposure. The calculation of the monoline credit valuation adjustment and
sensitivity to different methodologies that could be applied is described on page 154. Of the total credit valuation
adjustment at 31 December 2011 of US$1,050m (2010: US$1,355m), US$746m (2010: US$836m) relates to the
credit valuation adjustment taken against non-monoline counterparties. The methodology for calculating the credit
valuation adjustment for non-monoline counterparties is described below.
HSBC calculates the credit valuation adjustment by applying the probability of default of the counterparty to the
expected positive exposure to the counterparty, and multiplying the result by the loss expected in the event of default.
The calculation is performed over the life of the potential exposure.
The probability of default is based on HSBC’s internal credit rating for the counterparty, taking into account
how credit ratings may deteriorate over the duration of the exposure through the use of historical rating transition
matrices. For most products, to calculate the expected positive exposure to a counterparty, HSBC uses a simulation
methodology to incorporate the range of potential exposures across the portfolio of transactions with the counterparty
over the life of an instrument. The simulation methodology includes credit mitigants such as counterparty netting
agreements and collateral agreements with the counterparty. A standard loss given default assumption of 60% is
generally adopted. In respect of own credit risk, HSBC considers that a zero spread is appropriate and consequently
does not adjust derivative liabilities for HSBC’s own credit risk, such an adjustment is often referred to as a ‘debit
valuation adjustment’.
For certain types of exotic derivatives where the products are not currently supported by the simulation, or
for derivative exposures in smaller trading locations where the simulation tool is not yet available, HSBC adopts
alternative methodologies. These may involve mapping to the results for similar products from the simulation tool
or where such a mapping approach is not appropriate, a simplified methodology is used, generally following the same
principles as the simulation methodology. The calculation is applied at a trade level, with more limited recognition of
credit mitigants such as netting or collateral agreements than used in the simulation methodology described
previously.
The methodologies do not, in general, account for ‘wrong-way risk’. Wrong-way risk arises where the underlying
value of the derivative prior to any credit valuation adjustment is positively correlated to the probability of default of
the counterparty. Where there is significant wrong-way risk, a trade specific approach is applied to reflect the wrong-
way risk within the valuation.
HSBC includes all third-party counterparties in the credit valuation adjustment calculation and does not net credit
valuation adjustments across HSBC Group entities. During 2011, there were no material changes made by HSBC to
the methodologies used to calculate the credit valuation adjustment.
Consideration of other methodologies for calculation of credit valuation adjustments
Our credit valuation adjustment methodology, in the opinion of management, appropriately quantifies our exposure to
counterparty risk on our OTC derivative portfolio and appropriately reflects the risk management strategy of the
business.
We recognise that a variety of credit valuation adjustment methodologies are adopted within the banking industry.
Some of the key attributes that may differ between these methodologies are:
• the PD may be calculated from historical market data, or implied from current market levels for certain
transaction types such as CDSs, either with or without an adjusting factor;
• some entities adopt a non-zero ‘debit valuation adjustment’ which has the effect of reducing the overall
adjustment;