HSBC 2011 Annual Report Download - page 405
Download and view the complete annual report
Please find page 405 of the 2011 HSBC annual report below. You can navigate through the pages in the report by either clicking on the pages listed below, or by using the keyword search tool below to find specific information within the annual report.-
 1
1 -
2
-
3
-
4
-
5
-
6
-
7
-
8
-
9
-
10
-
11
-
12
-
13
-
14
-
15
-
16
-
17
-
18
-
19
-
20
-
21
-
22
-
23
-
24
-
25
-
26
-
27
-
28
-
29
-
30
-
31
-
32
-
33
-
34
-
35
-
36
-
37
-
38
-
39
-
40
-
41
-
42
-
43
-
44
-
45
-
46
-
47
-
48
-
49
-
50
-
51
-
52
-
53
-
54
-
55
-
56
-
57
-
58
-
59
-
60
-
61
-
62
-
63
-
64
-
65
-
66
-
67
-
68
-
69
-
70
-
71
-
72
-
73
-
74
-
75
-
76
-
77
-
78
-
79
-
80
-
81
-
82
-
83
-
84
-
85
-
86
-
87
-
88
-
89
-
90
-
91
-
92
-
93
-
94
-
95
-
96
-
97
-
98
-
99
-
100
-
101
-
102
-
103
-
104
-
105
-
106
-
107
-
108
-
109
-
110
-
111
-
112
-
113
-
114
-
115
-
116
-
117
-
118
-
119
-
120
-
121
-
122
-
123
-
124
-
125
-
126
-
127
-
128
-
129
-
130
-
131
-
132
-
133
-
134
-
135
-
136
-
137
-
138
-
139
-
140
-
141
-
142
-
143
-
144
-
145
-
146
-
147
-
148
-
149
-
150
-
151
-
152
-
153
-
154
-
155
-
156
-
157
-
158
-
159
-
160
-
161
-
162
-
163
-
164
-
165
-
166
-
167
-
168
-
169
-
170
-
171
-
172
-
173
-
174
-
175
-
176
-
177
-
178
-
179
-
180
-
181
-
182
-
183
-
184
-
185
-
186
-
187
-
188
-
189
-
190
-
191
-
192
-
193
-
194
-
195
-
196
-
197
-
198
-
199
-
200
-
201
-
202
-
203
-
204
-
205
-
206
-
207
-
208
-
209
-
210
-
211
-
212
-
213
-
214
-
215
-
216
-
217
-
218
-
219
-
220
-
221
-
222
-
223
-
224
-
225
-
226
-
227
-
228
-
229
-
230
-
231
-
232
-
233
-
234
-
235
-
236
-
237
-
238
-
239
-
240
-
241
-
242
-
243
-
244
-
245
-
246
-
247
-
248
-
249
-
250
-
251
-
252
-
253
-
254
-
255
-
256
-
257
-
258
-
259
-
260
-
261
-
262
-
263
-
264
-
265
-
266
-
267
-
268
-
269
-
270
-
271
-
272
-
273
-
274
-
275
-
276
-
277
-
278
-
279
-
280
-
281
-
282
-
283
-
284
-
285
-
286
-
287
-
288
-
289
-
290
-
291
-
292
-
293
-
294
-
295
-
296
-
297
-
298
-
299
-
300
-
301
-
302
-
303
-
304
-
305
-
306
-
307
-
308
-
309
-
310
-
311
-
312
-
313
-
314
-
315
-
316
-
317
-
318
-
319
-
320
-
321
-
322
-
323
-
324
-
325
-
326
-
327
-
328
-
329
-
330
-
331
-
332
-
333
-
334
-
335
-
336
-
337
-
338
-
339
-
340
-
341
-
342
-
343
-
344
-
345
-
346
-
347
-
348
-
349
-
350
-
351
-
352
-
353
-
354
-
355
-
356
-
357
-
358
-
359
-
360
-
361
-
362
-
363
-
364
-
365
-
366
-
367
-
368
-
369
-
370
-
371
-
372
-
373
-
374
-
375
-
376
-
377
-
378
-
379
-
380
-
381
-
382
-
383
-
384
-
385
-
386
-
387
-
388
-
389
-
390
-
391
-
392
-
393
-
394
-
 395
395 -
 396
396 -
 397
397 -
 398
398 -
 399
399 -
 400
400 -
 401
401 -
 402
402 -
 403
403 -
 404
404 -
 405
405 -
 406
406 -
 407
407 -
 408
408 -
 409
409 -
 410
410 -
 411
411 -
 412
412 -
 413
413 -
 414
414 -
 415
415 -
416
-
417
-
418
-
419
-
420
-
421
-
422
-
423
-
424
-
425
-
426
-
427
-
428
-
429
-
430
-
431
-
432
-
433
-
434
-
435
-
436
-
437
-
438
-
439
-
440
 |
 |

403
Overview Operating & Financial Review Corporate Governance Financial Statements Shareholder Information
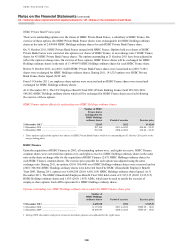
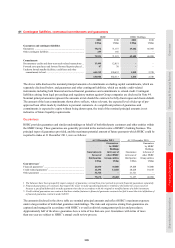
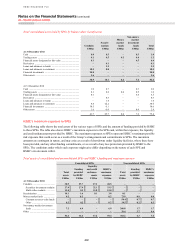
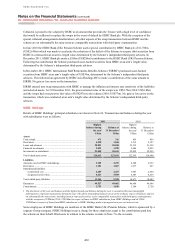
Consolidated SPEs Unconsolidated SPEs
Total
assets
Funding
provided
by HSBC
Liquidity
and credit
enchance-
ments
HSBC’s
maximum
exposure
Total
assets
Funding
provided
by HSBC
HSBC’s
maximum
exposure
US$bn US$bn US$bn US$bn US$bn US$bn US$bn
At 31 December 2010
Conduits ...................................... 41.7 28.6 38.3 50.5 – – –
Securities investment conduits 32.2 28.6 25.6 37.8 – – –
Multi-seller conduits .............. 9.5 – 12.7 12.7 – – –
Securitisations ................................ 25.7 1.9 0.1 4.7 9.9 – –
Money market funds ................... 0.4 0.4 – 0.4 95.8 0.7 0.7
Constant net asset value funds – – – – 74.9 0.5 0.5
Other ....................................... 0.4 0.4 – 0.4 20.9 0.2 0.2
Non-money market investment
funds ....................................... 7.6 6.9 – 6.9 274.7 1.7 1.7
Other ........................................... – – – – 19.0 9.4 3.7
75.4 37.8 38.4 62.5 399.4 11.8 6.1
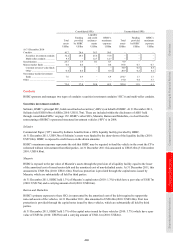
Conduits
HSBC sponsors and manages two types of conduits: securities investment conduits (‘SIC’s) and multi-seller conduits.
Securities investment conduits
Solitaire, HSBC’s principal SIC, holds asset-backed securities (‘ABS’s) on behalf of HSBC. At 31 December 2011,
Solitaire held US$10.6bn of ABSs (2010: US$11.7bn). These are included within the disclosures of ABS ‘held
through consolidated SPEs’ on page 152. HSBC’s other SICs, Mazarin, Barion and Malachite, evolved from the
restructuring of HSBC’s sponsored structured investment vehicles (‘SIV’s) in 2008.
Solitaire
Commercial Paper (‘CP’) issued by Solitaire benefits from a 100% liquidity facility provided by HSBC.
At 31 December 2011, US$9.3bn of Solitaire’s assets were funded by the draw-down of the liquidity facility (2010:
US$7.6bn). HSBC is exposed to credit losses on the drawn amounts.
HSBC’s maximum exposure represents the risk that HSBC may be required to fund the vehicle in the event the CP is
redeemed without reinvestment from third parties. At 31 December 2011 this amounted to US$15.6bn (31 December
2010: US$16.8bn).
Mazarin
HSBC is exposed to the par value of Mazarin’s assets through the provision of a liquidity facility equal to the lesser
of the amortised cost of issued senior debt and the amortised cost of non-defaulted assets. At 31 December 2011, this
amounted to US$9.5bn (2010: US$11.6bn). First loss protection is provided through the capital notes issued by
Mazarin, which are substantially all held by third parties.
At 31 December 2011, HSBC held 1.3% of Mazarin’s capital notes (2010: 1.3%) which have a par value of US$17m
(2010: US$17m) and a carrying amount of nil (2010: US$0.6m).
Barion and Malachite
HSBC’s primary exposure to these SICs is represented by the amortised cost of the debt required to support the
non-cash assets of the vehicles. At 31 December 2011, this amounted to US$8.4bn (2010: US$9.4bn). First loss
protection is provided through the capital notes issued by these vehicles, which are substantially all held by third
parties.
At 31 December 2011, HSBC held 3.7% of the capital notes issued by these vehicles (2010: 3.7%) which have a par
value of US$35m (2010: US$35m) and a carrying amount of US$1.1m (2010: US$2m).