HSBC 2011 Annual Report Download - page 63
Download and view the complete annual report
Please find page 63 of the 2011 HSBC annual report below. You can navigate through the pages in the report by either clicking on the pages listed below, or by using the keyword search tool below to find specific information within the annual report.-
 1
1 -
2
-
3
-
4
-
5
-
6
-
7
-
8
-
9
-
10
-
11
-
12
-
13
-
14
-
15
-
16
-
17
-
18
-
19
-
20
-
21
-
22
-
23
-
24
-
25
-
26
-
27
-
28
-
29
-
30
-
31
-
32
-
33
-
34
-
35
-
36
-
37
-
38
-
39
-
40
-
41
-
42
-
43
-
44
-
45
-
46
-
47
-
48
-
49
-
50
-
51
-
52
-
 53
53 -
 54
54 -
 55
55 -
 56
56 -
 57
57 -
 58
58 -
 59
59 -
 60
60 -
 61
61 -
 62
62 -
 63
63 -
 64
64 -
 65
65 -
 66
66 -
 67
67 -
 68
68 -
 69
69 -
 70
70 -
 71
71 -
 72
72 -
 73
73 -
74
-
75
-
76
-
77
-
78
-
79
-
80
-
81
-
82
-
83
-
84
-
85
-
86
-
87
-
88
-
89
-
90
-
91
-
92
-
93
-
94
-
95
-
96
-
97
-
98
-
99
-
100
-
101
-
102
-
103
-
104
-
105
-
106
-
107
-
108
-
109
-
110
-
111
-
112
-
113
-
114
-
115
-
116
-
117
-
118
-
119
-
120
-
121
-
122
-
123
-
124
-
125
-
126
-
127
-
128
-
129
-
130
-
131
-
132
-
133
-
134
-
135
-
136
-
137
-
138
-
139
-
140
-
141
-
142
-
143
-
144
-
145
-
146
-
147
-
148
-
149
-
150
-
151
-
152
-
153
-
154
-
155
-
156
-
157
-
158
-
159
-
160
-
161
-
162
-
163
-
164
-
165
-
166
-
167
-
168
-
169
-
170
-
171
-
172
-
173
-
174
-
175
-
176
-
177
-
178
-
179
-
180
-
181
-
182
-
183
-
184
-
185
-
186
-
187
-
188
-
189
-
190
-
191
-
192
-
193
-
194
-
195
-
196
-
197
-
198
-
199
-
200
-
201
-
202
-
203
-
204
-
205
-
206
-
207
-
208
-
209
-
210
-
211
-
212
-
213
-
214
-
215
-
216
-
217
-
218
-
219
-
220
-
221
-
222
-
223
-
224
-
225
-
226
-
227
-
228
-
229
-
230
-
231
-
232
-
233
-
234
-
235
-
236
-
237
-
238
-
239
-
240
-
241
-
242
-
243
-
244
-
245
-
246
-
247
-
248
-
249
-
250
-
251
-
252
-
253
-
254
-
255
-
256
-
257
-
258
-
259
-
260
-
261
-
262
-
263
-
264
-
265
-
266
-
267
-
268
-
269
-
270
-
271
-
272
-
273
-
274
-
275
-
276
-
277
-
278
-
279
-
280
-
281
-
282
-
283
-
284
-
285
-
286
-
287
-
288
-
289
-
290
-
291
-
292
-
293
-
294
-
295
-
296
-
297
-
298
-
299
-
300
-
301
-
302
-
303
-
304
-
305
-
306
-
307
-
308
-
309
-
310
-
311
-
312
-
313
-
314
-
315
-
316
-
317
-
318
-
319
-
320
-
321
-
322
-
323
-
324
-
325
-
326
-
327
-
328
-
329
-
330
-
331
-
332
-
333
-
334
-
335
-
336
-
337
-
338
-
339
-
340
-
341
-
342
-
343
-
344
-
345
-
346
-
347
-
348
-
349
-
350
-
351
-
352
-
353
-
354
-
355
-
356
-
357
-
358
-
359
-
360
-
361
-
362
-
363
-
364
-
365
-
366
-
367
-
368
-
369
-
370
-
371
-
372
-
373
-
374
-
375
-
376
-
377
-
378
-
379
-
380
-
381
-
382
-
383
-
384
-
385
-
386
-
387
-
388
-
389
-
390
-
391
-
392
-
393
-
394
-
395
-
396
-
397
-
398
-
399
-
400
-
401
-
402
-
403
-
404
-
405
-
406
-
407
-
408
-
409
-
410
-
411
-
412
-
413
-
414
-
415
-
416
-
417
-
418
-
419
-
420
-
421
-
422
-
423
-
424
-
425
-
426
-
427
-
428
-
429
-
430
-
431
-
432
-
433
-
434
-
435
-
436
-
437
-
438
-
439
-
440
 |
 |

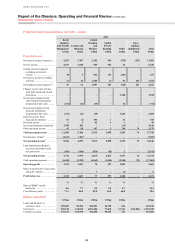
61
Overview Operating & Financial Review Corporate Governance Financial Statements Shareholder Information
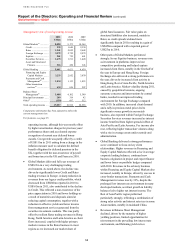
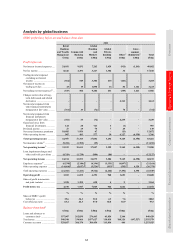
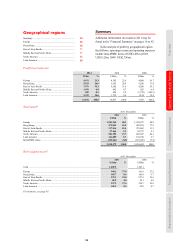
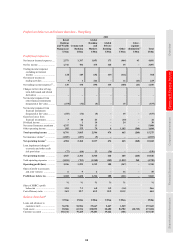
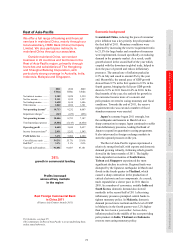
Profit/(loss) before tax by country within global businesses
Retail
Banking
and Wealth
Management17
US$m
Commercial
Banking
US$m
Global
Banking
and
Markets17
US$m
Global
Private
Banking
US$m
Other
US$m
Total
US$m
2011
UK ........................................................ 1,330 1,227 (265) 192 1,037 3,521
France44 ................................................ 69 192 (194) 16 18 101
Germany .............................................. 36 69 203 28 16 352
Malta .................................................... 31 72 21 – – 124
Switzerland .......................................... – (8) – 225 – 217
Turkey .................................................. 7 62 87 2 – 158
Other .................................................... (151) 73 225 94 (43) 198
1,322 1,687 77 557 1,028 4,671
2010
UK ........................................................ 1,181 827 1,772 223 (1,605) 2,398
France44 ................................................ 138 135 376 18 26 693
Germany .............................................. 36 32 231 30 4 333
Malta .................................................... 37 56 17 – – 110
Switzerland .......................................... – (5) – 265 – 260
Turkey .................................................. 64 80 105 1 – 250
Other .................................................... (144) 80 202 103 17 258
1,312 1,205 2,703 640 (1,558) 4,302
2009
UK ........................................................ 331 1,026 3,078 252 (2,561) 2,126
France44 ................................................ 67 102 881 3 (429) 624
Germany .............................................. 34 21 221 32 (18) 290
Malta .................................................... 33 58 9 – – 100
Switzerland .......................................... – – 5 448 (3) 450
Turkey .................................................. 43 97 119 2 – 261
Other .................................................... (183) (12) 219 117 17 158
325 1,292 4,532 854 (2,994) 4,009
For footnotes, see page 95.
improve cost efficiency and organisational
effectiveness, we took measures to streamline our
processes with the aim of lowering the future cost
base of our operations while maintaining high
standards of service. As a result of these initiatives,
total restructuring costs of US$404m were incurred
across the region in 2011.
In RBWM, further progress was made in
implementing our strategy of building long-term
sustainable relationships with Premier customers.
The Wealth Management business continued to
develop with HSBC World Selection assets under
management increasing by 21% during 2011 to
£2.5bn (US$3.8bn) as a result of a strategic focus
and continued marketing. The Global Investment
Centre service was successfully launched in October
2011, enabling investors to hold and trade a wide
range of third party and HSBC funds on-line.
We continued to support the UK housing market
during 2011, achieving strong growth in mortgage
balances driven by successful marketing campaigns.
Our share of new lending increased to 10% in 2011,
while maintaining a conservative loan to value ratio
of 53% on new lending. To support our customers
through the prevailing economic conditions, we
committed to make available £350m (US$542m) to
UK mortgage borrowers with deposits of 15% or
less. In addition, an increase in the customer base of
5% contributed to a growth in our UK deposit
balances of 4%.
In CMB, we made further progress on our
strategy of becoming the leading international trade
and business bank with a significant increase in the
number of international customers, resulting in
strong income growth from our trade-related
business. We continue to strengthen our partnership
with GB&M with a focus on driving product income
growth, particularly in strategic financing and
treasury risk management products. We also
achieved strong growth in UK lending, reflecting
our continued support to UK businesses during the
difficult economic conditions. We exceeded our
2011 lending intentions under the Project Merlin
agreement with the UK Government, both in terms
of total and SME facilities.