HSBC 2011 Annual Report Download - page 171
Download and view the complete annual report
Please find page 171 of the 2011 HSBC annual report below. You can navigate through the pages in the report by either clicking on the pages listed below, or by using the keyword search tool below to find specific information within the annual report.-
 1
1 -
2
-
3
-
4
-
5
-
6
-
7
-
8
-
9
-
10
-
11
-
12
-
13
-
14
-
15
-
16
-
17
-
18
-
19
-
20
-
21
-
22
-
23
-
24
-
25
-
26
-
27
-
28
-
29
-
30
-
31
-
32
-
33
-
34
-
35
-
36
-
37
-
38
-
39
-
40
-
41
-
42
-
43
-
44
-
45
-
46
-
47
-
48
-
49
-
50
-
51
-
52
-
53
-
54
-
55
-
56
-
57
-
58
-
59
-
60
-
61
-
62
-
63
-
64
-
65
-
66
-
67
-
68
-
69
-
70
-
71
-
72
-
73
-
74
-
75
-
76
-
77
-
78
-
79
-
80
-
81
-
82
-
83
-
84
-
85
-
86
-
87
-
88
-
89
-
90
-
91
-
92
-
93
-
94
-
95
-
96
-
97
-
98
-
99
-
100
-
101
-
102
-
103
-
104
-
105
-
106
-
107
-
108
-
109
-
110
-
111
-
112
-
113
-
114
-
115
-
116
-
117
-
118
-
119
-
120
-
121
-
122
-
123
-
124
-
125
-
126
-
127
-
128
-
129
-
130
-
131
-
132
-
133
-
134
-
135
-
136
-
137
-
138
-
139
-
140
-
141
-
142
-
143
-
144
-
145
-
146
-
147
-
148
-
149
-
150
-
151
-
152
-
153
-
154
-
155
-
156
-
157
-
158
-
159
-
160
-
 161
161 -
 162
162 -
 163
163 -
 164
164 -
 165
165 -
 166
166 -
 167
167 -
 168
168 -
 169
169 -
 170
170 -
 171
171 -
 172
172 -
 173
173 -
 174
174 -
 175
175 -
 176
176 -
 177
177 -
 178
178 -
 179
179 -
 180
180 -
 181
181 -
182
-
183
-
184
-
185
-
186
-
187
-
188
-
189
-
190
-
191
-
192
-
193
-
194
-
195
-
196
-
197
-
198
-
199
-
200
-
201
-
202
-
203
-
204
-
205
-
206
-
207
-
208
-
209
-
210
-
211
-
212
-
213
-
214
-
215
-
216
-
217
-
218
-
219
-
220
-
221
-
222
-
223
-
224
-
225
-
226
-
227
-
228
-
229
-
230
-
231
-
232
-
233
-
234
-
235
-
236
-
237
-
238
-
239
-
240
-
241
-
242
-
243
-
244
-
245
-
246
-
247
-
248
-
249
-
250
-
251
-
252
-
253
-
254
-
255
-
256
-
257
-
258
-
259
-
260
-
261
-
262
-
263
-
264
-
265
-
266
-
267
-
268
-
269
-
270
-
271
-
272
-
273
-
274
-
275
-
276
-
277
-
278
-
279
-
280
-
281
-
282
-
283
-
284
-
285
-
286
-
287
-
288
-
289
-
290
-
291
-
292
-
293
-
294
-
295
-
296
-
297
-
298
-
299
-
300
-
301
-
302
-
303
-
304
-
305
-
306
-
307
-
308
-
309
-
310
-
311
-
312
-
313
-
314
-
315
-
316
-
317
-
318
-
319
-
320
-
321
-
322
-
323
-
324
-
325
-
326
-
327
-
328
-
329
-
330
-
331
-
332
-
333
-
334
-
335
-
336
-
337
-
338
-
339
-
340
-
341
-
342
-
343
-
344
-
345
-
346
-
347
-
348
-
349
-
350
-
351
-
352
-
353
-
354
-
355
-
356
-
357
-
358
-
359
-
360
-
361
-
362
-
363
-
364
-
365
-
366
-
367
-
368
-
369
-
370
-
371
-
372
-
373
-
374
-
375
-
376
-
377
-
378
-
379
-
380
-
381
-
382
-
383
-
384
-
385
-
386
-
387
-
388
-
389
-
390
-
391
-
392
-
393
-
394
-
395
-
396
-
397
-
398
-
399
-
400
-
401
-
402
-
403
-
404
-
405
-
406
-
407
-
408
-
409
-
410
-
411
-
412
-
413
-
414
-
415
-
416
-
417
-
418
-
419
-
420
-
421
-
422
-
423
-
424
-
425
-
426
-
427
-
428
-
429
-
430
-
431
-
432
-
433
-
434
-
435
-
436
-
437
-
438
-
439
-
440
 |
 |

169
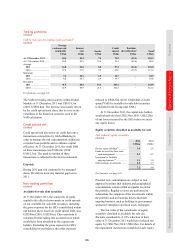
Overview Operating & Financial Review Corporate Governance Financial Statements Shareholder Information
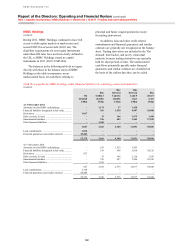
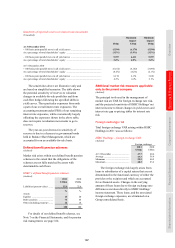
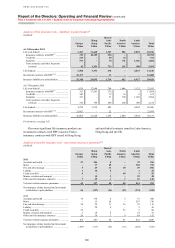
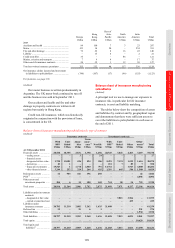
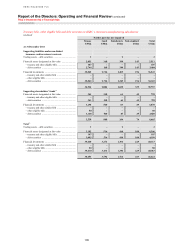
Repricing gap analysis of HSBC Holdings
(Audited)
Total
Up to
1 year
1–5 years 5–10 years
More than
10 years
Non-
interest
bearing
US$m US$m US$m US$m US$m US$m
At 31 December 2011
Cash at bank and in hand:
– balances with HSBC undertakings .............. 316 280 – – – 36
Derivatives .......................................................... 3,568 – – – – 3,568
Loans and advances to HSBC undertakings ...... 28,048 25,373 1,175 279 603 618
Financial investments ......................................... 1,078 – 300 731 – 47
Investments in subsidiaries ................................. 90,621 232 875 – – 89,514
Other assets ......................................................... 231 – – – – 231
Total assets .......................................................... 123,862 25,885 2,350 1,010 603 94,014
Amounts owed to HSBC undertakings .............. (2,479) (2,260) – – – (219)
Financial liabilities designated at fair values ..... (21,151) (2,694) (6,423) (6,157) (5,156) (721)
Derivatives .......................................................... (1,067) – – – – (1,067)
Debt securities in issue ....................................... (2,613) – (1,617) – (1,006) 10
Other liabilities ................................................... (911) – – – – (911)
Subordinated liabilities ....................................... (12,450) (776) (774) (2,070) (8,671) (159)
Total equity ......................................................... (82,183) – – – – (82,183)
Other non-interest bearing liabilities .................. (1,008) – – – – (1,008)
Total liabilities and equity .................................. (123,862) (5,730) (8,814) (8,227) (14,833) (86,258)
Off-balance sheet items attracting interest rate
sensitivity ........................................................ – (17,945) 6,405 5,749 5,048 743
Net interest rate risk gap ..................................... – 2,210 (59) (1,468) (9,182) 8,499
Cumulative interest rate gap ............................... – 2,210 2,151 683 (8,499) –
At 31 December 2010
Cash at bank and in hand:
– balances with HSBC undertakings .............. 459 339 – – – 120
Derivatives .......................................................... 2,327 – – – – 2,327
Loans and advances to HSBC undertakings ...... 21,238 19,351 – 290 605 992
Financial investments ......................................... 2,025 – 300 900 731 94
Investments in subsidiaries ................................. 92,899 1,785 875 1,164 – 89,075
Other assets ......................................................... 393 – – – – 393
Total assets .......................................................... 119,341 21,475 1,175 2,354 1,336 93,001
Amounts owed to HSBC undertakings .............. (2,932) (2,266) – – – (666)
Financial liabilities designated at fair values ..... (16,288) – (7,184) (4,740) (3,509) (855)
Derivatives .......................................................... (827) – – – – (827)
Debt securities in issue ....................................... (2,668) – (1,664) – (1,004) –
Other liabilities ................................................... (1,232) – – – – (1,232)
Subordinated liabilities ....................................... (13,313) (750) (1,579) (2,140) (8,680) (164)
Total equity ......................................................... (81,331) – – (7,450) – (73,881)
Other non-interest bearing liabilities .................. (750) – – – – (750)
Total liabilities and equity .................................. (119,341) (3,016) (10,427) (14,330) (13,193) (78,375)
Off-balance sheet items attracting interest rate
sensitivity ........................................................ – (15,302) 7,221 4,403 3,409 269
Net interest rate risk gap ..................................... – 3,157 (2,031) (7,573) (8,448) 14,895
Cumulative interest rate gap ............................... – 3,157 1,126 (6,447) (14,895) –