HSBC 2011 Annual Report Download - page 126
Download and view the complete annual report
Please find page 126 of the 2011 HSBC annual report below. You can navigate through the pages in the report by either clicking on the pages listed below, or by using the keyword search tool below to find specific information within the annual report.-
 1
1 -
2
-
3
-
4
-
5
-
6
-
7
-
8
-
9
-
10
-
11
-
12
-
13
-
14
-
15
-
16
-
17
-
18
-
19
-
20
-
21
-
22
-
23
-
24
-
25
-
26
-
27
-
28
-
29
-
30
-
31
-
32
-
33
-
34
-
35
-
36
-
37
-
38
-
39
-
40
-
41
-
42
-
43
-
44
-
45
-
46
-
47
-
48
-
49
-
50
-
51
-
52
-
53
-
54
-
55
-
56
-
57
-
58
-
59
-
60
-
61
-
62
-
63
-
64
-
65
-
66
-
67
-
68
-
69
-
70
-
71
-
72
-
73
-
74
-
75
-
76
-
77
-
78
-
79
-
80
-
81
-
82
-
83
-
84
-
85
-
86
-
87
-
88
-
89
-
90
-
91
-
92
-
93
-
94
-
95
-
96
-
97
-
98
-
99
-
100
-
101
-
102
-
103
-
104
-
105
-
106
-
107
-
108
-
109
-
110
-
111
-
112
-
113
-
114
-
115
-
 116
116 -
 117
117 -
 118
118 -
 119
119 -
 120
120 -
 121
121 -
 122
122 -
 123
123 -
 124
124 -
 125
125 -
 126
126 -
 127
127 -
 128
128 -
 129
129 -
 130
130 -
 131
131 -
 132
132 -
 133
133 -
 134
134 -
 135
135 -
 136
136 -
137
-
138
-
139
-
140
-
141
-
142
-
143
-
144
-
145
-
146
-
147
-
148
-
149
-
150
-
151
-
152
-
153
-
154
-
155
-
156
-
157
-
158
-
159
-
160
-
161
-
162
-
163
-
164
-
165
-
166
-
167
-
168
-
169
-
170
-
171
-
172
-
173
-
174
-
175
-
176
-
177
-
178
-
179
-
180
-
181
-
182
-
183
-
184
-
185
-
186
-
187
-
188
-
189
-
190
-
191
-
192
-
193
-
194
-
195
-
196
-
197
-
198
-
199
-
200
-
201
-
202
-
203
-
204
-
205
-
206
-
207
-
208
-
209
-
210
-
211
-
212
-
213
-
214
-
215
-
216
-
217
-
218
-
219
-
220
-
221
-
222
-
223
-
224
-
225
-
226
-
227
-
228
-
229
-
230
-
231
-
232
-
233
-
234
-
235
-
236
-
237
-
238
-
239
-
240
-
241
-
242
-
243
-
244
-
245
-
246
-
247
-
248
-
249
-
250
-
251
-
252
-
253
-
254
-
255
-
256
-
257
-
258
-
259
-
260
-
261
-
262
-
263
-
264
-
265
-
266
-
267
-
268
-
269
-
270
-
271
-
272
-
273
-
274
-
275
-
276
-
277
-
278
-
279
-
280
-
281
-
282
-
283
-
284
-
285
-
286
-
287
-
288
-
289
-
290
-
291
-
292
-
293
-
294
-
295
-
296
-
297
-
298
-
299
-
300
-
301
-
302
-
303
-
304
-
305
-
306
-
307
-
308
-
309
-
310
-
311
-
312
-
313
-
314
-
315
-
316
-
317
-
318
-
319
-
320
-
321
-
322
-
323
-
324
-
325
-
326
-
327
-
328
-
329
-
330
-
331
-
332
-
333
-
334
-
335
-
336
-
337
-
338
-
339
-
340
-
341
-
342
-
343
-
344
-
345
-
346
-
347
-
348
-
349
-
350
-
351
-
352
-
353
-
354
-
355
-
356
-
357
-
358
-
359
-
360
-
361
-
362
-
363
-
364
-
365
-
366
-
367
-
368
-
369
-
370
-
371
-
372
-
373
-
374
-
375
-
376
-
377
-
378
-
379
-
380
-
381
-
382
-
383
-
384
-
385
-
386
-
387
-
388
-
389
-
390
-
391
-
392
-
393
-
394
-
395
-
396
-
397
-
398
-
399
-
400
-
401
-
402
-
403
-
404
-
405
-
406
-
407
-
408
-
409
-
410
-
411
-
412
-
413
-
414
-
415
-
416
-
417
-
418
-
419
-
420
-
421
-
422
-
423
-
424
-
425
-
426
-
427
-
428
-
429
-
430
-
431
-
432
-
433
-
434
-
435
-
436
-
437
-
438
-
439
-
440
 |
 |

HSBC HOLDINGS PLC
Report of the Directors: Operating and Financial Review (continued)
Risk > Credit risk > Areas of special interest > US personal lending
124
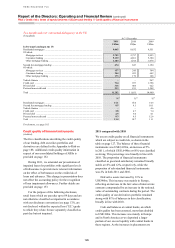
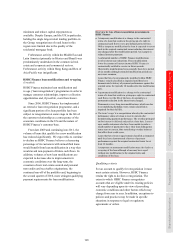
US personal lending
(Unaudited)
Credit quality
During 2011, economic conditions in the US
remained challenging. However, they began to show
signs of improvement during the fourth quarter as
employment growth accelerated, in part due to
seasonal hiring, and increased consumer spending.
House prices remained under pressure during 2011
due to foreclosure levels, which remained high,
despite the industry-wide delays in foreclosure
processing.
Unemployment rates, which are a major factor
in the deterioration of credit quality, remained high
at 8.5% in December 2011, down from 9.4% in
December 2010. Unemployment rates were at or
above the US national average in 17 states.
A future improvement in the US economy
remains dependant upon a recovery in the housing
market, a fall in unemployment rates, the
stabilisation of energy prices and improved
consumer confidence. Any further weakening in
these factors may continue to adversely affect
consumer payment patterns and credit quality.
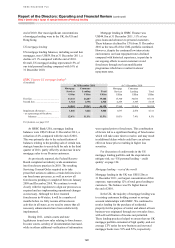
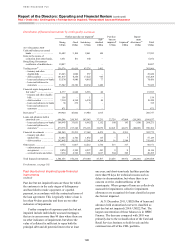
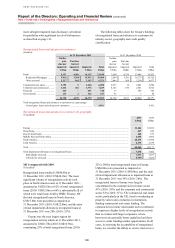
Mortgage lending
In 2011, we further reduced our mortgage exposure
in the US as balances continued to run-off in the CML
portfolio, as discussed on page 122. At 31 December
2011, residential mortgage lending balances were
US$52.5bn, a decline of 9% compared with the end of
2010. The ratio of impairment allowances to total
mortgage lending in HSBC Finance increased from
8.5% at 31 December 2010 to 11.5% at 31 December
2011. This increase largely reflected the effects of the
delays in foreclosure activity and the increased
forbearance activity within the portfolio.
Real estate markets in the US have been affected
by stagnation or declines in property values. As a
result, LTV ratios for our real estate secured loans
have generally deteriorated since origination. Lending
balances with LTV ratios of greater than 100% have
historically had a greater likelihood of becoming
delinquent, resulting in higher loss severity which
could adversely affect our loan impairment
allowances. For more information on residential
mortgages by levels of collateral, see page 144.
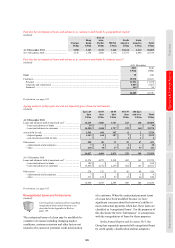
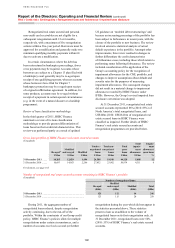
In the CML portfolio, two months or more
delinquent balances increased compared with the end
of 2010. This was due to the temporary suspension of
foreclosure activities, which resulted in a slowing in
the rate at which lending balances were transferred to
foreclosed. As a result, in our Consumer Lending
portfolio, two months or more delinquent balances
increased in dollar terms from US$4.9bn at
31 December 2010 to US$5.1bn at 31 December
2011, while in our Mortgage Services portfolio they
remained unchanged at US$2.8bn.
At HSBC Bank USA, two months or more
delinquency rates increased from 7.9% to 8.2%
at 31 December 2011, reflecting the suspension of
foreclosure activities.
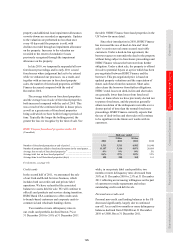
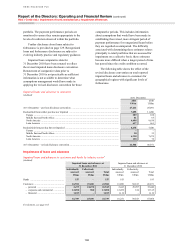
Second lien mortgage loans have a risk profile
characterised by higher LTV ratios because in the
majority of cases the loans were taken out
to complete the refinancing of properties. Loss
experience on default of second lien loans has
typically approached 100% of the amount
outstanding, as any equity in the property is initially
applied to the first lien loan. The majority of second
lien loans are to customers that hold a first lien
mortgage issued by a third party. Impairment
allowances for these loans are determined by
applying a roll-rate migration analysis which
captures the propensity of these loans to default
based on past experience. Approximately 97% of
our US second lien mortgages, where the first lien
mortgages are held or serviced by us and have a
delinquency status of 90 days or more past due,
are themselves 90 days or more past due. Once
we assume a second lien mortgage loan is likely to
progress to write-off, the loss severity assumed in
establishing our impairment allowance is close to
100%. In the US, second lien mortgage balances
declined by 24% to US$7.1bn at 31 December 2011,
representing 12% of the overall US mortgage
lending portfolio. Two months or more delinquent
balances were US$0.7bn at 31 December 2011
compared with US$0.8bn at 31 December 2010.
Prior to foreclosure, carrying amounts of the
loans in excess of fair value less costs to sell are
written down to the discounted cash flows expected
to be recovered, including from the sale of the
property. Broker price opinions are obtained and
updated every 180 days and real estate price trends
are reviewed quarterly to reflect any improvement
or additional deterioration. Our methodology is
regularly validated by comparing the discounted
cash flows expected to be recovered based on current
market conditions (including estimated cash flows
from the sale of the property) to the updated broker
price opinion, adjusted for the estimated historical
difference between interior and exterior appraisals.
The fair values of foreclosed properties are initially
determined based on broker price opinions. Within
90 days of foreclosure, a more detailed property
valuation is performed reflecting information
obtained from a physical interior inspection of the