HSBC 2007 Annual Report Download - page 98
Download and view the complete annual report
Please find page 98 of the 2007 HSBC annual report below. You can navigate through the pages in the report by either clicking on the pages listed below, or by using the keyword search tool below to find specific information within the annual report.-
 1
1 -
2
-
3
-
4
-
5
-
6
-
7
-
8
-
9
-
10
-
11
-
12
-
13
-
14
-
15
-
16
-
17
-
18
-
19
-
20
-
21
-
22
-
23
-
24
-
25
-
26
-
27
-
28
-
29
-
30
-
31
-
32
-
33
-
34
-
35
-
36
-
37
-
38
-
39
-
40
-
41
-
42
-
43
-
44
-
45
-
46
-
47
-
48
-
49
-
50
-
51
-
52
-
53
-
54
-
55
-
56
-
57
-
58
-
59
-
60
-
61
-
62
-
63
-
64
-
65
-
66
-
67
-
68
-
69
-
70
-
71
-
72
-
73
-
74
-
75
-
76
-
77
-
78
-
79
-
80
-
81
-
82
-
83
-
84
-
85
-
86
-
87
-
 88
88 -
 89
89 -
 90
90 -
 91
91 -
 92
92 -
 93
93 -
 94
94 -
 95
95 -
 96
96 -
 97
97 -
 98
98 -
 99
99 -
 100
100 -
 101
101 -
 102
102 -
 103
103 -
 104
104 -
 105
105 -
 106
106 -
 107
107 -
 108
108 -
109
-
110
-
111
-
112
-
113
-
114
-
115
-
116
-
117
-
118
-
119
-
120
-
121
-
122
-
123
-
124
-
125
-
126
-
127
-
128
-
129
-
130
-
131
-
132
-
133
-
134
-
135
-
136
-
137
-
138
-
139
-
140
-
141
-
142
-
143
-
144
-
145
-
146
-
147
-
148
-
149
-
150
-
151
-
152
-
153
-
154
-
155
-
156
-
157
-
158
-
159
-
160
-
161
-
162
-
163
-
164
-
165
-
166
-
167
-
168
-
169
-
170
-
171
-
172
-
173
-
174
-
175
-
176
-
177
-
178
-
179
-
180
-
181
-
182
-
183
-
184
-
185
-
186
-
187
-
188
-
189
-
190
-
191
-
192
-
193
-
194
-
195
-
196
-
197
-
198
-
199
-
200
-
201
-
202
-
203
-
204
-
205
-
206
-
207
-
208
-
209
-
210
-
211
-
212
-
213
-
214
-
215
-
216
-
217
-
218
-
219
-
220
-
221
-
222
-
223
-
224
-
225
-
226
-
227
-
228
-
229
-
230
-
231
-
232
-
233
-
234
-
235
-
236
-
237
-
238
-
239
-
240
-
241
-
242
-
243
-
244
-
245
-
246
-
247
-
248
-
249
-
250
-
251
-
252
-
253
-
254
-
255
-
256
-
257
-
258
-
259
-
260
-
261
-
262
-
263
-
264
-
265
-
266
-
267
-
268
-
269
-
270
-
271
-
272
-
273
-
274
-
275
-
276
-
277
-
278
-
279
-
280
-
281
-
282
-
283
-
284
-
285
-
286
-
287
-
288
-
289
-
290
-
291
-
292
-
293
-
294
-
295
-
296
-
297
-
298
-
299
-
300
-
301
-
302
-
303
-
304
-
305
-
306
-
307
-
308
-
309
-
310
-
311
-
312
-
313
-
314
-
315
-
316
-
317
-
318
-
319
-
320
-
321
-
322
-
323
-
324
-
325
-
326
-
327
-
328
-
329
-
330
-
331
-
332
-
333
-
334
-
335
-
336
-
337
-
338
-
339
-
340
-
341
-
342
-
343
-
344
-
345
-
346
-
347
-
348
-
349
-
350
-
351
-
352
-
353
-
354
-
355
-
356
-
357
-
358
-
359
-
360
-
361
-
362
-
363
-
364
-
365
-
366
-
367
-
368
-
369
-
370
-
371
-
372
-
373
-
374
-
375
-
376
-
377
-
378
-
379
-
380
-
381
-
382
-
383
-
384
-
385
-
386
-
387
-
388
-
389
-
390
-
391
-
392
-
393
-
394
-
395
-
396
-
397
-
398
-
399
-
400
-
401
-
402
-
403
-
404
-
405
-
406
-
407
-
408
-
409
-
410
-
411
-
412
-
413
-
414
-
415
-
416
-
417
-
418
-
419
-
420
-
421
-
422
-
423
-
424
-
425
-
426
-
427
-
428
-
429
-
430
-
431
-
432
-
433
-
434
-
435
-
436
-
437
-
438
-
439
-
440
-
441
-
442
-
443
-
444
-
445
-
446
-
447
-
448
-
449
-
450
-
451
-
452
-
453
-
454
-
455
-
456
-
457
-
458
-
459
-
460
-
461
-
462
-
463
-
464
-
465
-
466
-
467
-
468
-
469
-
470
-
471
-
472
-
473
-
474
-
475
-
476
 |
 |

HSBC HOLDINGS PLC
Report of the Directors: Business Review (continued)
North America > 2007
96
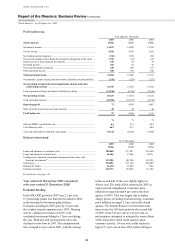
in servicing fees on mortgages, credit card fees and
deposit service charges.
Trading losses in 2007 were US$215 million
compared with trading income of US$274 million in
2006. Conditions in the housing market meant that
sub-prime mortgages could not be securitised, which
led to significantly wider credit spreads and a
considerable loss of market liquidity across all asset-
backed securities classes. These two factors, the loss
of liquidity and wider credit spreads, resulted in
substantial reductions in the value of mortgages held
for sale. In light of this, HSBC closed Decision One,
its wholesale mortgage business, in the second half
of 2007.
Gains less losses from financial instruments rose
to US$176 million from US$14 million in 2006, due
to the sale of MasterCard Inc. shares following its
IPO.
Other operating income fell by 109 per cent.
Losses on foreclosed properties rose due to the
combined effect of an increase in the stock of such
properties and a reduction in their value due to
falling prices. Total foreclosed assets rose to
US$1.0 billion from US$670 million in 2006. The
fall in other operating income also reflected a
US$123 million gain in 2006 (from the sale of
HSBC’s investment in Kanbay, a global IT services
firm) which did not recur in 2007.
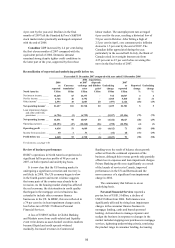
Loan impairment charges and other
credit risk provisions rose by 78 per cent to
US$11.9 billion. US loan impairment charges rose
by 79 per cent as the deterioration in housing credit
markets extended to affect loans of all product types
and vintages, particularly loans originated in 2005,
2006 and the first half of 2007. The combination of
reduced financing options for consumers and weak
or falling property values had a significant impact on
delinquency levels. Developments in the credit
markets have raised fundamental concerns about the
viability of the ‘originate and distribute’ business
model for securitising residential mortgages. The
resulting industry-wide tightening of underwriting
criteria, and the elimination of many loan products
previously offered to consumers, reduced the general
availability of credit and borrowers’ ability to
refinance. This, in turn, exacerbated house price
falls, most notably in those areas which had seen the
most rapid appreciation in recent years.
Lower house prices reduced the equity which
customers had in their homes, removing a key source
of accessible funds and reducing customers’ capacity
to deal with unexpected problems such as
unemployment or illness. Bankruptcy levels also
increased from the exceptionally low levels seen
in 2006 which followed changes in bankruptcy
legislation in 2005.
In mortgage services, loan impairment charges
rose by 41 per cent to US$3.1 billion. Due to the
factors noted above, delinquencies increased at a
higher rate than was expected from normal portfolio
seasoning1, particularly for second lien customers.
In consumer lending, loan impairment charges
rose by 139 per cent to US$4.1 billion as evidence of
credit quality deterioration was seen across the loan
portfolio in the second half of 2007, in particular on
first lien loans originated in 2006. There was also
increased delinquency on second lien loans
purchased between 2004 and the third quarter of
2006. Lower run-offs of loans, growth in average
lending balances, normal seasoning and a rise in
bankruptcy filings to historically more usual levels
after the exceptional decline in 2006, also
contributed to the rise. There was a marked increase
in loan delinquency in those states most affected by
the fall in home values.
Credit card impairment charges rose by 83 per
cent to US$2.8 billion as a result of weaker
economic trends, growth in balances, normal
portfolio seasoning, a rise in bankruptcy rates closer
to historical levels, and a shift in mix to a higher
proportion of non-prime loans.
Loan impairment charges in Canada rose by
38 per cent, in line with the rise in loan balances and
seasoning of the vehicle finance and credit card
portfolios. In addition, an impairment charge on non-
bank asset-backed commercial paper (‘ABCP’) was
recognised in 2007.
Operating expenses rose by 2 per cent to
US$7.6 billion. In the US, while origination costs
fell as loan growth was curtailed, additional
resources were deployed to collection activities and
the retail bank added selectively to its branch
distribution network. Within the consumer finance
operations, restructuring costs in 2007 totalled
US$103 million, following the decision to reposition
the US consumer finance business, the closure of the
wholesale mortgage services business and the
reduction in the number of branches in the US
consumer lending network to around 1,000 to align
with the level of demand expected in light of the
Group’s revised risk appetite. The retail bank
incurred higher staff costs due to expansion of the
branch network, higher average salaries due to
normal annual pay increases, and a change in mix of
1 ‘Seasoning’ describes the emergence of credit loss patterns in portfolios over time.