HSBC 2007 Annual Report Download - page 13
Download and view the complete annual report
Please find page 13 of the 2007 HSBC annual report below. You can navigate through the pages in the report by either clicking on the pages listed below, or by using the keyword search tool below to find specific information within the annual report.-
 1
1 -
2
-
 3
3 -
 4
4 -
 5
5 -
 6
6 -
 7
7 -
 8
8 -
 9
9 -
 10
10 -
 11
11 -
 12
12 -
 13
13 -
 14
14 -
 15
15 -
 16
16 -
 17
17 -
 18
18 -
 19
19 -
 20
20 -
 21
21 -
 22
22 -
 23
23 -
24
-
25
-
26
-
27
-
28
-
29
-
30
-
31
-
32
-
33
-
34
-
35
-
36
-
37
-
38
-
39
-
40
-
41
-
42
-
43
-
44
-
45
-
46
-
47
-
48
-
49
-
50
-
51
-
52
-
53
-
54
-
55
-
56
-
57
-
58
-
59
-
60
-
61
-
62
-
63
-
64
-
65
-
66
-
67
-
68
-
69
-
70
-
71
-
72
-
73
-
74
-
75
-
76
-
77
-
78
-
79
-
80
-
81
-
82
-
83
-
84
-
85
-
86
-
87
-
88
-
89
-
90
-
91
-
92
-
93
-
94
-
95
-
96
-
97
-
98
-
99
-
100
-
101
-
102
-
103
-
104
-
105
-
106
-
107
-
108
-
109
-
110
-
111
-
112
-
113
-
114
-
115
-
116
-
117
-
118
-
119
-
120
-
121
-
122
-
123
-
124
-
125
-
126
-
127
-
128
-
129
-
130
-
131
-
132
-
133
-
134
-
135
-
136
-
137
-
138
-
139
-
140
-
141
-
142
-
143
-
144
-
145
-
146
-
147
-
148
-
149
-
150
-
151
-
152
-
153
-
154
-
155
-
156
-
157
-
158
-
159
-
160
-
161
-
162
-
163
-
164
-
165
-
166
-
167
-
168
-
169
-
170
-
171
-
172
-
173
-
174
-
175
-
176
-
177
-
178
-
179
-
180
-
181
-
182
-
183
-
184
-
185
-
186
-
187
-
188
-
189
-
190
-
191
-
192
-
193
-
194
-
195
-
196
-
197
-
198
-
199
-
200
-
201
-
202
-
203
-
204
-
205
-
206
-
207
-
208
-
209
-
210
-
211
-
212
-
213
-
214
-
215
-
216
-
217
-
218
-
219
-
220
-
221
-
222
-
223
-
224
-
225
-
226
-
227
-
228
-
229
-
230
-
231
-
232
-
233
-
234
-
235
-
236
-
237
-
238
-
239
-
240
-
241
-
242
-
243
-
244
-
245
-
246
-
247
-
248
-
249
-
250
-
251
-
252
-
253
-
254
-
255
-
256
-
257
-
258
-
259
-
260
-
261
-
262
-
263
-
264
-
265
-
266
-
267
-
268
-
269
-
270
-
271
-
272
-
273
-
274
-
275
-
276
-
277
-
278
-
279
-
280
-
281
-
282
-
283
-
284
-
285
-
286
-
287
-
288
-
289
-
290
-
291
-
292
-
293
-
294
-
295
-
296
-
297
-
298
-
299
-
300
-
301
-
302
-
303
-
304
-
305
-
306
-
307
-
308
-
309
-
310
-
311
-
312
-
313
-
314
-
315
-
316
-
317
-
318
-
319
-
320
-
321
-
322
-
323
-
324
-
325
-
326
-
327
-
328
-
329
-
330
-
331
-
332
-
333
-
334
-
335
-
336
-
337
-
338
-
339
-
340
-
341
-
342
-
343
-
344
-
345
-
346
-
347
-
348
-
349
-
350
-
351
-
352
-
353
-
354
-
355
-
356
-
357
-
358
-
359
-
360
-
361
-
362
-
363
-
364
-
365
-
366
-
367
-
368
-
369
-
370
-
371
-
372
-
373
-
374
-
375
-
376
-
377
-
378
-
379
-
380
-
381
-
382
-
383
-
384
-
385
-
386
-
387
-
388
-
389
-
390
-
391
-
392
-
393
-
394
-
395
-
396
-
397
-
398
-
399
-
400
-
401
-
402
-
403
-
404
-
405
-
406
-
407
-
408
-
409
-
410
-
411
-
412
-
413
-
414
-
415
-
416
-
417
-
418
-
419
-
420
-
421
-
422
-
423
-
424
-
425
-
426
-
427
-
428
-
429
-
430
-
431
-
432
-
433
-
434
-
435
-
436
-
437
-
438
-
439
-
440
-
441
-
442
-
443
-
444
-
445
-
446
-
447
-
448
-
449
-
450
-
451
-
452
-
453
-
454
-
455
-
456
-
457
-
458
-
459
-
460
-
461
-
462
-
463
-
464
-
465
-
466
-
467
-
468
-
469
-
470
-
471
-
472
-
473
-
474
-
475
-
476
 |
 |

11
• efficiency will be enhanced by taking full
advantage of local, regional and global
economies of scale in particular by adopting
a common systems architecture; and
• appropriate objectives and incentives will be
adopted to motivate and reward staff for being
fully engaged in delivering the strategy.
Key performance indicators
The Board of Directors and the Group Management
Board monitors HSBC’s progress against its strategic
objectives. Progress is assessed by comparison with
the Group’s strategy, its operating plan targets and its
historical performance using both financial and non-
financial measures.
As a prerequisite for the vesting of performance
shares, the Remuneration Committee must satisfy
itself that HSBC’s financial performance has shown
a sustained improvement in the period since the
award date. In determining this, the Remuneration
Committee takes into account HSBC’s financial
performance with regard to the financial key
performance indicators (‘KPIs’) described below.
For awards made since 2005, the financial KPIs are
compared with the same group of 28 comparator
banks as for the total shareholder return (‘TSR’)
performance condition.
Financial KPIs
To support the Group’s strategy and ensure that
HSBC’s performance can be monitored,
management utilises a number of financial KPIs. The
table below presents these KPIs for the period from
2004 to 2007. At a business level, the KPIs are
complemented by a range of benchmarks which are
relevant to the planning process and to reviewing
business performance.
HSBC is publishing a number of key targets
against which future performance can be measured.
Financial targets have been set as follows: the return
on average total shareholders’ equity over the
medium term has been set at 15-19 per cent; the cost
efficiency ratio has been set in the range of 48-52 per
cent; and the TSR in the top half of that achieved by
peers. The cost efficiency ratio has been set as a
range within which the business is expected to
remain in order to accommodate the need for
continued investment in support of future business
growth.
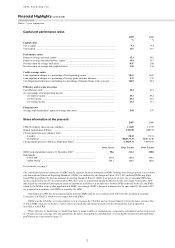
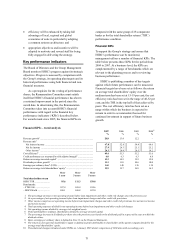
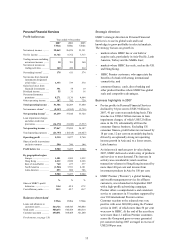
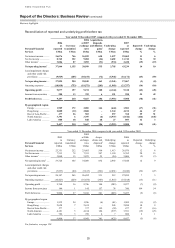
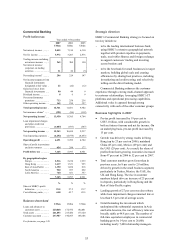
Financial KPIs – trend analysis
2007 2006 2005 200410
% % % %
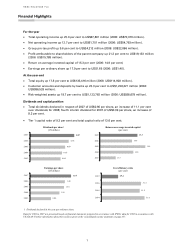
Revenue growth1 ........................................................................................... 20.8 13.4 12.2 –
Revenue mix2
Net interest income .................................................................................. 47.8 52.8 54.4 60.6
Net fee income ......................................................................................... 27.9 26.3 25.1 25.2
Other income3 ........................................................................................... 24.3 20.9 20.5 14.2
Cost efficiency4 ............................................................................................. 49.4 51.3 51.2 51.6
Credit performance as measured by risk adjusted margin5 .......................... 6.0 6.3 6.3 6.8
Return on average invested capital6 ............................................................. 15.3 14.9 15.9 15.0
Dividends per share growth7 ........................................................................ 11.1 11.0 10.6 10.0
Earnings per ordinary share8 (US$)............................................................... 1.65 1.40 1.36 1.18
Return on average total shareholders’ equity9 .............................................. 15.9 15.7 16.8 16.3
Over Over Over
1 year 3 years 5 years
Total shareholder return
HSBC TSR ......................... 95.6 111.3 158.8
Benchmarks:
– FTSE 100 ........................ 107.4 148.4 194.6
– MSCI World .................... 108.1 140.8 182.0
1 The percentage increase in net operating income before loan impairment and other credit risk charges since the previous year.
2 As a percentage of net operating income before loan impairment charges and other credit risk provisions.
3 Other income comprises net operating income before loan impairment charges and other credit risk provisions less net interest income
and net fee income.
4 Total operating expenses divided by net operating income before loan impairment and other credit risk charges.
5 Net operating income divided by average risk-weighted assets.
6 Profit attributable to ordinary shareholders divided by average invested capital.
7 The percentage increase in dividends per share since the previous year, based on the dividends paid in respect of the year to which the
dividend relates.
8 Basic earnings per ordinary share is defined in Note 13 on the Financial Statements.
9 The return on average total shareholders’ equity is defined as profit attributable to shareholders of the parent company divided by the
average total shareholders’ equity.
10 Presentational changes introduced under IFRSs on 1 January 2005 distort comparison of 2004 data with succeeding years.