HSBC 2007 Annual Report Download - page 241
Download and view the complete annual report
Please find page 241 of the 2007 HSBC annual report below. You can navigate through the pages in the report by either clicking on the pages listed below, or by using the keyword search tool below to find specific information within the annual report.-
 1
1 -
2
-
3
-
4
-
5
-
6
-
7
-
8
-
9
-
10
-
11
-
12
-
13
-
14
-
15
-
16
-
17
-
18
-
19
-
20
-
21
-
22
-
23
-
24
-
25
-
26
-
27
-
28
-
29
-
30
-
31
-
32
-
33
-
34
-
35
-
36
-
37
-
38
-
39
-
40
-
41
-
42
-
43
-
44
-
45
-
46
-
47
-
48
-
49
-
50
-
51
-
52
-
53
-
54
-
55
-
56
-
57
-
58
-
59
-
60
-
61
-
62
-
63
-
64
-
65
-
66
-
67
-
68
-
69
-
70
-
71
-
72
-
73
-
74
-
75
-
76
-
77
-
78
-
79
-
80
-
81
-
82
-
83
-
84
-
85
-
86
-
87
-
88
-
89
-
90
-
91
-
92
-
93
-
94
-
95
-
96
-
97
-
98
-
99
-
100
-
101
-
102
-
103
-
104
-
105
-
106
-
107
-
108
-
109
-
110
-
111
-
112
-
113
-
114
-
115
-
116
-
117
-
118
-
119
-
120
-
121
-
122
-
123
-
124
-
125
-
126
-
127
-
128
-
129
-
130
-
131
-
132
-
133
-
134
-
135
-
136
-
137
-
138
-
139
-
140
-
141
-
142
-
143
-
144
-
145
-
146
-
147
-
148
-
149
-
150
-
151
-
152
-
153
-
154
-
155
-
156
-
157
-
158
-
159
-
160
-
161
-
162
-
163
-
164
-
165
-
166
-
167
-
168
-
169
-
170
-
171
-
172
-
173
-
174
-
175
-
176
-
177
-
178
-
179
-
180
-
181
-
182
-
183
-
184
-
185
-
186
-
187
-
188
-
189
-
190
-
191
-
192
-
193
-
194
-
195
-
196
-
197
-
198
-
199
-
200
-
201
-
202
-
203
-
204
-
205
-
206
-
207
-
208
-
209
-
210
-
211
-
212
-
213
-
214
-
215
-
216
-
217
-
218
-
219
-
220
-
221
-
222
-
223
-
224
-
225
-
226
-
227
-
228
-
229
-
230
-
 231
231 -
 232
232 -
 233
233 -
 234
234 -
 235
235 -
 236
236 -
 237
237 -
 238
238 -
 239
239 -
 240
240 -
 241
241 -
 242
242 -
 243
243 -
 244
244 -
 245
245 -
 246
246 -
 247
247 -
 248
248 -
 249
249 -
 250
250 -
 251
251 -
252
-
253
-
254
-
255
-
256
-
257
-
258
-
259
-
260
-
261
-
262
-
263
-
264
-
265
-
266
-
267
-
268
-
269
-
270
-
271
-
272
-
273
-
274
-
275
-
276
-
277
-
278
-
279
-
280
-
281
-
282
-
283
-
284
-
285
-
286
-
287
-
288
-
289
-
290
-
291
-
292
-
293
-
294
-
295
-
296
-
297
-
298
-
299
-
300
-
301
-
302
-
303
-
304
-
305
-
306
-
307
-
308
-
309
-
310
-
311
-
312
-
313
-
314
-
315
-
316
-
317
-
318
-
319
-
320
-
321
-
322
-
323
-
324
-
325
-
326
-
327
-
328
-
329
-
330
-
331
-
332
-
333
-
334
-
335
-
336
-
337
-
338
-
339
-
340
-
341
-
342
-
343
-
344
-
345
-
346
-
347
-
348
-
349
-
350
-
351
-
352
-
353
-
354
-
355
-
356
-
357
-
358
-
359
-
360
-
361
-
362
-
363
-
364
-
365
-
366
-
367
-
368
-
369
-
370
-
371
-
372
-
373
-
374
-
375
-
376
-
377
-
378
-
379
-
380
-
381
-
382
-
383
-
384
-
385
-
386
-
387
-
388
-
389
-
390
-
391
-
392
-
393
-
394
-
395
-
396
-
397
-
398
-
399
-
400
-
401
-
402
-
403
-
404
-
405
-
406
-
407
-
408
-
409
-
410
-
411
-
412
-
413
-
414
-
415
-
416
-
417
-
418
-
419
-
420
-
421
-
422
-
423
-
424
-
425
-
426
-
427
-
428
-
429
-
430
-
431
-
432
-
433
-
434
-
435
-
436
-
437
-
438
-
439
-
440
-
441
-
442
-
443
-
444
-
445
-
446
-
447
-
448
-
449
-
450
-
451
-
452
-
453
-
454
-
455
-
456
-
457
-
458
-
459
-
460
-
461
-
462
-
463
-
464
-
465
-
466
-
467
-
468
-
469
-
470
-
471
-
472
-
473
-
474
-
475
-
476
 |
 |
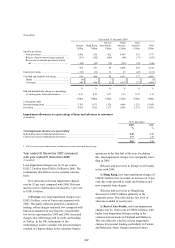
239
Releases and recoveries in Europe of
US$860 million were 17 per cent higher than in
2005. Increases in the UK were partially offset by a
decline in France. In the UK, increased resources
deployed on collection activities, combined with a
rise in sales of delinquent debt, were reflected in
significantly higher recoveries. The non-recurrence
of several significant recoveries in 2005 led to a
large fall in France.
In Hong Kong, new loan impairment charges
declined by 22 per cent to US$243 million,
reflecting the non-recurrence of an individual charge
in 2005 for a large commercial customer. This was
partly offset by a rise in credit card impairments as a
result of a rise in balances. Overall, credit quality
remained stable as strong economic growth and low
levels of unemployment continued.
Releases and recoveries fell by 49 per cent to
US$86 million, again mainly as a result of fewer
individual impairment releases in the corporate and
commercial sector and the non-recurrence of
mortgage lending recoveries in 2005, following
improvement in the property market since 2004.
In Rest of Asia-Pacific, there was an 88 per
cent rise in new impairment allowances to
US$737 million. This was an improvement on the
situation in the first half of 2006, when new
impairment charges were 111 per cent higher than in
the first half of 2005. The year-on-year increase was
largely due to Taiwan and, to a lesser extent,
Indonesia. During the first half of 2006, new
government regulations placing restrictions on
collection activity, combined with the popularity of
renegotiation schemes offering the opportunity to
waive interest and postpone principal payments, led
to a sharp rise in credit card defaults, for which a
full-year charge of US$200 million was recorded. In
the second half of 2006, this problem had begun to
moderate and new impairment charges were 31 per
cent lower than in the first half. In Indonesia,
increased loan impairment charges in the personal
sector reflected legislation which introduced higher
minimum payment rules and a reduction in fuel
subsidies. There were further rises in the Middle
East, largely due to loan growth. Elsewhere in the
region, credit quality was stable.
Releases and recoveries in the region fell by
11 per cent to US$225 million. The fall was mainly
in Malaysia and was partly offset by a rise in
commercial releases and recoveries in the Middle
East.
In North America, new loan impairment
charges rose by 36 per cent. Excluding Metris,
new charges increased by 30 per cent. Credit
deterioration, mainly in second lien, some portions
of first lien and adjustable-rate mortgages acquired
from third party correspondents through HSBC’s
mortgage services business, were the primary cause
of the rise in new charges. As the housing market in
the US slowed through 2006 and interest rates rose,
delinquency trends on both second lien and portions
of first lien mortgages originated in 2005 and 2006
were higher than for loans made in previous years. In
addition, the extra payment obligations arising from
the repricing of adjustable-rate mortgages to higher
rates added to the assessed impairment of the
correspondent portfolio, in particular in respect of
second lien mortgages ranking behind adjustable-
rate first lien mortgages.
As interest rate adjustments will be occurring in
an environment of lower home value appreciation
and tightening credit, it is estimated that the
probability of default on adjustable-rate first
mortgages subject to repricing, and on any second
lien mortgage loans that are subordinate to an
adjustable-rate first lien, will be greater than has
been experienced in the past. As a result, loan
impairment charges relating to the mortgage services
portfolio have increased significantly.
In the second half of 2006, HSBC took action to
tighten credit criteria in the mortgage services
operation as detailed on page 217. As a consequence,
balances in mortgage services declined compared
with 30 June 2006.
Notwithstanding the credit weakness witnessed
in the mortgage services business, credit delinquency
in the majority of the other portfolios, including
mortgage balances originated through the branch-
based consumer lending business, rose modestly,
driven by portfolio ageing and an increased
proportion of credit card loans following the Metris
acquisition. Partially offsetting factors included the
effects of a decline in bankruptcy filings, especially
in the first half of 2006 following the spike in the
fourth quarter of 2005, low unemployment and the
non-recurrence of charges relating to hurricane
Katrina.
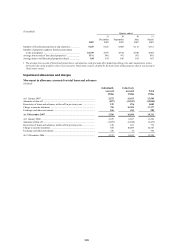
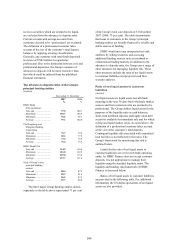
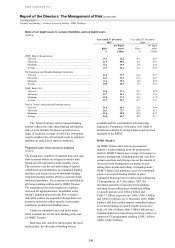
HSBC in the US closely monitors the two-
month-and-over contractual delinquency ratio (being
the ratio of two or more months delinquent accounts
to gross loans and advances), as management views
this as an important indicator of future write-offs.
Details are disclosed below. The rise in the total ratio
was chiefly as a result of the mortgage services
business.
The increase in the US was partly offset by a
small decline in new loan impairment charges in