HSBC 2007 Annual Report Download - page 124
Download and view the complete annual report
Please find page 124 of the 2007 HSBC annual report below. You can navigate through the pages in the report by either clicking on the pages listed below, or by using the keyword search tool below to find specific information within the annual report.-
 1
1 -
2
-
3
-
4
-
5
-
6
-
7
-
8
-
9
-
10
-
11
-
12
-
13
-
14
-
15
-
16
-
17
-
18
-
19
-
20
-
21
-
22
-
23
-
24
-
25
-
26
-
27
-
28
-
29
-
30
-
31
-
32
-
33
-
34
-
35
-
36
-
37
-
38
-
39
-
40
-
41
-
42
-
43
-
44
-
45
-
46
-
47
-
48
-
49
-
50
-
51
-
52
-
53
-
54
-
55
-
56
-
57
-
58
-
59
-
60
-
61
-
62
-
63
-
64
-
65
-
66
-
67
-
68
-
69
-
70
-
71
-
72
-
73
-
74
-
75
-
76
-
77
-
78
-
79
-
80
-
81
-
82
-
83
-
84
-
85
-
86
-
87
-
88
-
89
-
90
-
91
-
92
-
93
-
94
-
95
-
96
-
97
-
98
-
99
-
100
-
101
-
102
-
103
-
104
-
105
-
106
-
107
-
108
-
109
-
110
-
111
-
112
-
113
-
 114
114 -
 115
115 -
 116
116 -
 117
117 -
 118
118 -
 119
119 -
 120
120 -
 121
121 -
 122
122 -
 123
123 -
 124
124 -
 125
125 -
 126
126 -
 127
127 -
 128
128 -
 129
129 -
 130
130 -
 131
131 -
 132
132 -
 133
133 -
 134
134 -
135
-
136
-
137
-
138
-
139
-
140
-
141
-
142
-
143
-
144
-
145
-
146
-
147
-
148
-
149
-
150
-
151
-
152
-
153
-
154
-
155
-
156
-
157
-
158
-
159
-
160
-
161
-
162
-
163
-
164
-
165
-
166
-
167
-
168
-
169
-
170
-
171
-
172
-
173
-
174
-
175
-
176
-
177
-
178
-
179
-
180
-
181
-
182
-
183
-
184
-
185
-
186
-
187
-
188
-
189
-
190
-
191
-
192
-
193
-
194
-
195
-
196
-
197
-
198
-
199
-
200
-
201
-
202
-
203
-
204
-
205
-
206
-
207
-
208
-
209
-
210
-
211
-
212
-
213
-
214
-
215
-
216
-
217
-
218
-
219
-
220
-
221
-
222
-
223
-
224
-
225
-
226
-
227
-
228
-
229
-
230
-
231
-
232
-
233
-
234
-
235
-
236
-
237
-
238
-
239
-
240
-
241
-
242
-
243
-
244
-
245
-
246
-
247
-
248
-
249
-
250
-
251
-
252
-
253
-
254
-
255
-
256
-
257
-
258
-
259
-
260
-
261
-
262
-
263
-
264
-
265
-
266
-
267
-
268
-
269
-
270
-
271
-
272
-
273
-
274
-
275
-
276
-
277
-
278
-
279
-
280
-
281
-
282
-
283
-
284
-
285
-
286
-
287
-
288
-
289
-
290
-
291
-
292
-
293
-
294
-
295
-
296
-
297
-
298
-
299
-
300
-
301
-
302
-
303
-
304
-
305
-
306
-
307
-
308
-
309
-
310
-
311
-
312
-
313
-
314
-
315
-
316
-
317
-
318
-
319
-
320
-
321
-
322
-
323
-
324
-
325
-
326
-
327
-
328
-
329
-
330
-
331
-
332
-
333
-
334
-
335
-
336
-
337
-
338
-
339
-
340
-
341
-
342
-
343
-
344
-
345
-
346
-
347
-
348
-
349
-
350
-
351
-
352
-
353
-
354
-
355
-
356
-
357
-
358
-
359
-
360
-
361
-
362
-
363
-
364
-
365
-
366
-
367
-
368
-
369
-
370
-
371
-
372
-
373
-
374
-
375
-
376
-
377
-
378
-
379
-
380
-
381
-
382
-
383
-
384
-
385
-
386
-
387
-
388
-
389
-
390
-
391
-
392
-
393
-
394
-
395
-
396
-
397
-
398
-
399
-
400
-
401
-
402
-
403
-
404
-
405
-
406
-
407
-
408
-
409
-
410
-
411
-
412
-
413
-
414
-
415
-
416
-
417
-
418
-
419
-
420
-
421
-
422
-
423
-
424
-
425
-
426
-
427
-
428
-
429
-
430
-
431
-
432
-
433
-
434
-
435
-
436
-
437
-
438
-
439
-
440
-
441
-
442
-
443
-
444
-
445
-
446
-
447
-
448
-
449
-
450
-
451
-
452
-
453
-
454
-
455
-
456
-
457
-
458
-
459
-
460
-
461
-
462
-
463
-
464
-
465
-
466
-
467
-
468
-
469
-
470
-
471
-
472
-
473
-
474
-
475
-
476
 |
 |

HSBC HOLDINGS PLC
Report of the Directors: Business Review (continued)
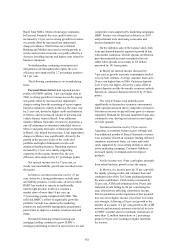
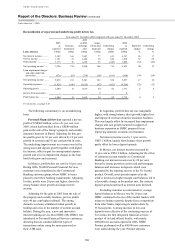
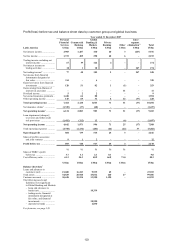
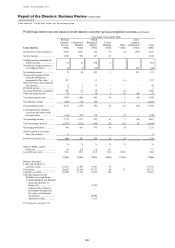
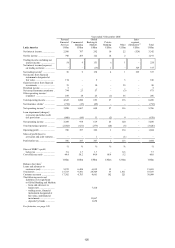
Latin America > 2006 / Profit/(loss) before tax by customer group
122
In Brazil, expenses grew by 19 per cent,
also largely from higher staff, marketing and
administrative costs. Business expansion activities in
the small and middle market customer segments
followed the recruitment of 270 additional employees
and this, together with union-agreed pay increases,
were the principal drivers behind the 21 per cent rise
in staff costs. Continued enlargement of the branch
network, the opening of an International Banking
Centre and new sales offices combined with increases
in marketing and administration costs in support of
business expansion, contributed further to cost
growth. Costs in Argentina rose by 30 per cent,
primarily staff costs which reflected annual pay
increases and additional headcount driven by
accelerated business activity. In supporting the
growth of the business, there was increased
expenditure on branding, technology and distribution,
with ongoing improvements made to the internet
banking service.
Global Banking and Markets reported a pre-
tax profit of US$475 million, an increase of 30 per
cent compared with 2005. HSBC’s strong global
presence, together with selective investment in
extending service and delivery capabilities in the
region, resulted in higher volumes with new and
existing clients. The cost efficiency ratio improved
moderately.
Total operating income increased by 23 per cent
to US$846 million compared with 2005. In Brazil,
balance sheet management revenues grew
significantly as relatively low short-term interest rates
reduced funding costs. In Argentina, higher net
interest income reflected an increase in index linked
securities portfolios and a growing demand for credit
as regional economies and market confidence
continued their recent improvement. By contrast, in
Mexico, balance sheet management revenues were
constrained by a flattening of the interest rate curve
and relatively stable market conditions.
Net interest income from payments and cash
management rose by 64 per cent as customer volumes
grew, reflecting new client mandates.
Net fee income increased by 29 per cent to
US$167 million, predominantly through increased
performance-related fees on emerging markets funds
managed by HSBC Global Asset Management.
Income in securities services benefited from strong
equity market indices and growth in new business as
assets under custody increased significantly to
US$89 billion.
In Mexico, a 32 per cent rise in payments and
cash management fees was driven by a wider product
offering and the leveraging of established credit
related products and services.
Higher revenues from trading activities in Brazil
flowed from marketing the wider product range and
enhanced delivery capabilities of Global Markets.
Greater volatility in local markets resulted in higher
business volumes in foreign exchange and currency
derivatives. In Argentina, economic and political
stability increased liquidity in the market with foreign
exchange trading benefiting from greater customer
activity. In Mexico, a 23 per cent increase in trading
income was driven by a combination of successful
positioning for a flattening yield curve and higher
client volumes delivered through the extended suite
of products.
A net release of US$26 million in loan
impairment charges reflected a stable corporate credit
environment and the implementation of improved
risk management strategies in Mexico.
Operating expenses rose by 20 per cent to
US$346 million, primarily driven by higher staff
costs reflecting increased performance-related
incentives in line with revenue growth, and pay rises
agreed with local unions. Higher operational costs
reflected increased volumes, particularly in payments
and cash management and securities services
businesses, and the continued investment in building
the Global Banking and Markets’ business in the
region.
Private Banking reported a pre-tax profit of
US$14 million, a significant increase on 2005. Profit
growth was strong in both Mexico and Brazil. In
Brazil, revenue and cost benefits arose from
initiatives to join up the business, including cross-
referrals with other customer groups. Strong revenue
growth in the newly launched business in Mexico
resulted primarily from greater client participation in
capital markets, notably commercial paper
placements, which contributed towards a 53 per cent
rise in fee income. This strong performance was
reflected in the cost efficiency ratio which improved
by 23.4 percentage points to 65.9 per cent.
Within Other, the non-recurrence of coverage
bond receipts and other items related to the 2001
Argentinean sovereign debt crisis led to lower
earnings.