HSBC 2007 Annual Report Download - page 246
Download and view the complete annual report
Please find page 246 of the 2007 HSBC annual report below. You can navigate through the pages in the report by either clicking on the pages listed below, or by using the keyword search tool below to find specific information within the annual report.-
 1
1 -
2
-
3
-
4
-
5
-
6
-
7
-
8
-
9
-
10
-
11
-
12
-
13
-
14
-
15
-
16
-
17
-
18
-
19
-
20
-
21
-
22
-
23
-
24
-
25
-
26
-
27
-
28
-
29
-
30
-
31
-
32
-
33
-
34
-
35
-
36
-
37
-
38
-
39
-
40
-
41
-
42
-
43
-
44
-
45
-
46
-
47
-
48
-
49
-
50
-
51
-
52
-
53
-
54
-
55
-
56
-
57
-
58
-
59
-
60
-
61
-
62
-
63
-
64
-
65
-
66
-
67
-
68
-
69
-
70
-
71
-
72
-
73
-
74
-
75
-
76
-
77
-
78
-
79
-
80
-
81
-
82
-
83
-
84
-
85
-
86
-
87
-
88
-
89
-
90
-
91
-
92
-
93
-
94
-
95
-
96
-
97
-
98
-
99
-
100
-
101
-
102
-
103
-
104
-
105
-
106
-
107
-
108
-
109
-
110
-
111
-
112
-
113
-
114
-
115
-
116
-
117
-
118
-
119
-
120
-
121
-
122
-
123
-
124
-
125
-
126
-
127
-
128
-
129
-
130
-
131
-
132
-
133
-
134
-
135
-
136
-
137
-
138
-
139
-
140
-
141
-
142
-
143
-
144
-
145
-
146
-
147
-
148
-
149
-
150
-
151
-
152
-
153
-
154
-
155
-
156
-
157
-
158
-
159
-
160
-
161
-
162
-
163
-
164
-
165
-
166
-
167
-
168
-
169
-
170
-
171
-
172
-
173
-
174
-
175
-
176
-
177
-
178
-
179
-
180
-
181
-
182
-
183
-
184
-
185
-
186
-
187
-
188
-
189
-
190
-
191
-
192
-
193
-
194
-
195
-
196
-
197
-
198
-
199
-
200
-
201
-
202
-
203
-
204
-
205
-
206
-
207
-
208
-
209
-
210
-
211
-
212
-
213
-
214
-
215
-
216
-
217
-
218
-
219
-
220
-
221
-
222
-
223
-
224
-
225
-
226
-
227
-
228
-
229
-
230
-
231
-
232
-
233
-
234
-
235
-
 236
236 -
 237
237 -
 238
238 -
 239
239 -
 240
240 -
 241
241 -
 242
242 -
 243
243 -
 244
244 -
 245
245 -
 246
246 -
 247
247 -
 248
248 -
 249
249 -
 250
250 -
 251
251 -
 252
252 -
 253
253 -
 254
254 -
 255
255 -
 256
256 -
257
-
258
-
259
-
260
-
261
-
262
-
263
-
264
-
265
-
266
-
267
-
268
-
269
-
270
-
271
-
272
-
273
-
274
-
275
-
276
-
277
-
278
-
279
-
280
-
281
-
282
-
283
-
284
-
285
-
286
-
287
-
288
-
289
-
290
-
291
-
292
-
293
-
294
-
295
-
296
-
297
-
298
-
299
-
300
-
301
-
302
-
303
-
304
-
305
-
306
-
307
-
308
-
309
-
310
-
311
-
312
-
313
-
314
-
315
-
316
-
317
-
318
-
319
-
320
-
321
-
322
-
323
-
324
-
325
-
326
-
327
-
328
-
329
-
330
-
331
-
332
-
333
-
334
-
335
-
336
-
337
-
338
-
339
-
340
-
341
-
342
-
343
-
344
-
345
-
346
-
347
-
348
-
349
-
350
-
351
-
352
-
353
-
354
-
355
-
356
-
357
-
358
-
359
-
360
-
361
-
362
-
363
-
364
-
365
-
366
-
367
-
368
-
369
-
370
-
371
-
372
-
373
-
374
-
375
-
376
-
377
-
378
-
379
-
380
-
381
-
382
-
383
-
384
-
385
-
386
-
387
-
388
-
389
-
390
-
391
-
392
-
393
-
394
-
395
-
396
-
397
-
398
-
399
-
400
-
401
-
402
-
403
-
404
-
405
-
406
-
407
-
408
-
409
-
410
-
411
-
412
-
413
-
414
-
415
-
416
-
417
-
418
-
419
-
420
-
421
-
422
-
423
-
424
-
425
-
426
-
427
-
428
-
429
-
430
-
431
-
432
-
433
-
434
-
435
-
436
-
437
-
438
-
439
-
440
-
441
-
442
-
443
-
444
-
445
-
446
-
447
-
448
-
449
-
450
-
451
-
452
-
453
-
454
-
455
-
456
-
457
-
458
-
459
-
460
-
461
-
462
-
463
-
464
-
465
-
466
-
467
-
468
-
469
-
470
-
471
-
472
-
473
-
474
-
475
-
476
 |
 |

HSBC HOLDINGS PLC
Report of the Directors: The Management of Risk (continued)
Liquidity and funding > Primary sources of funding
244
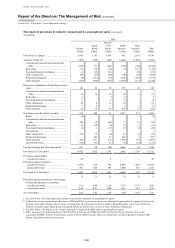
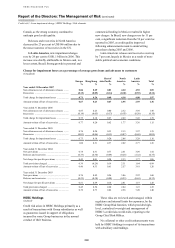
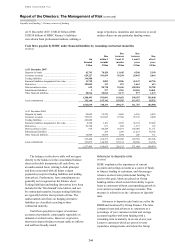
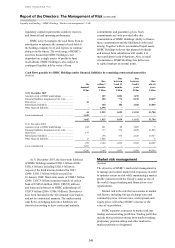
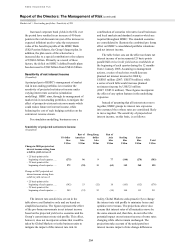
At 31 December 2007, US$142 billion (2006:
US$150 billion) of HSBC Finance’s liabilities
were drawn from professional markets, utilising a
range of products, maturities and currencies to avoid
undue reliance on any particular funding source.
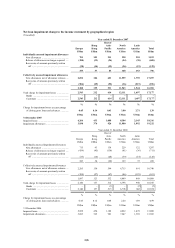
Cash flows payable by HSBC under financial liabilities by remaining contractual maturities
(Audited)
On
demand
US$m
Due
within 3
months
US$m
Due
between
3 and 12
months
US$m
Due
between
1 and 5
years
US$m
Due
after 5
years
US$m
At 31 December 2007
Deposits by banks ......................................................... 42,793 78,429 11,445 4,208 5,199
Customer accounts ........................................................ 629,227 391,659 56,294 29,445 6,614
Trading liabilities .......................................................... 314,580 – – – –
Financial liabilities designated at fair value ................. 11,730 2,083 8,286 43,147 68,726
Derivatives .................................................................... 181,009 113 873 1,663 613
Debt securities in issue ................................................. 635 90,718 59,626 109,054 38,782
Subordinated liabilities ................................................. 3 277 1,951 10,181 34,841
Other financial liabilities .............................................. 20,516 29,812 5,177 977 1,273
1,200,493 593,091 143,652 198,675 156,048
Loan commitments ....................................................... 312,146 155,142 155,565 113,072 28,532
1,512,639 748,233 299,217 311,747 184,580
At 31 December 2006
Deposits by banks ......................................................... 29,609 55,239 8,462 6,356 4,893
Customer accounts ........................................................ 535,695 301,847 47,560 25,155 5,420
Trading liabilities .......................................................... 226,608 – – – –
Financial liabilities designated at fair value ................. 8,990 1,103 2,855 36,194 52,222
Derivatives .................................................................... 99,790 671 884 1,337 167
Debt securities in issue ................................................. 919 80,288 38,831 102,069 51,171
Subordinated liabilities ................................................. – 285 1,296 11,221 30,764
Other financial liabilities .............................................. 14,809 34,838 1,094 206 711
916,420 474,271 100,982 182,538 145,348
Loan commitments ....................................................... 321,075 144,382 125,141 89,306 34,726
1,237,495 618,653 226,123 271,844 180,074
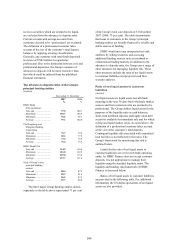
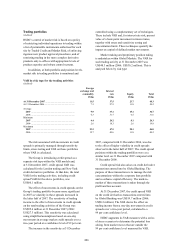
The balances in the above table will not agree
directly to the balances in the consolidated balance
sheet as the table incorporates all cash flows, on
an undiscounted basis, relating to both principal
and those associated with all future coupon
payments (except for trading liabilities and trading
derivatives). Furthermore, loan commitments are
generally not recognised on the balance sheet.
Trading liabilities and trading derivatives have been
included in the ‘On demand’ time bucket, and not
by contractual maturity, because trading liabilities
are typically held for short periods of time. The
undiscounted cash flows on hedging derivative
liabilities are classified according to their
contractual maturity.
Cash flows payable in respect of customer
accounts are primarily contractually repayable on
demand or at short notice. However, in practice,
short-term deposit balances remain stable as inflows
and outflows broadly match.
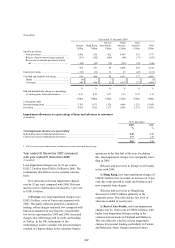
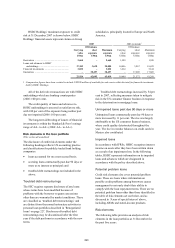
Advances to deposits ratio
(Audited)
HSBC emphasises the importance of current
accounts and savings accounts as a source of funds
to finance lending to customers, and discourages
reliance on short-term professional funding. To
achieve this goal, limits are placed on Group
banking entities which restrict their ability to grow
loans to customers without corresponding growth in
core current accounts and savings accounts. This
measure is referred to as the ‘advances to deposits’
ratio.
Advances to deposits ratio limits are set by the
RMM and monitored by Group Finance. The ratio
compares loans and advances to customers as a
percentage of core customer current and savings
accounts together with term funding with a
remaining term to maturity in excess of one year.
Loans to customers which are part of reverse
repurchase arrangements, and where the Group