HSBC 2007 Annual Report Download - page 290
Download and view the complete annual report
Please find page 290 of the 2007 HSBC annual report below. You can navigate through the pages in the report by either clicking on the pages listed below, or by using the keyword search tool below to find specific information within the annual report.-
 1
1 -
2
-
3
-
4
-
5
-
6
-
7
-
8
-
9
-
10
-
11
-
12
-
13
-
14
-
15
-
16
-
17
-
18
-
19
-
20
-
21
-
22
-
23
-
24
-
25
-
26
-
27
-
28
-
29
-
30
-
31
-
32
-
33
-
34
-
35
-
36
-
37
-
38
-
39
-
40
-
41
-
42
-
43
-
44
-
45
-
46
-
47
-
48
-
49
-
50
-
51
-
52
-
53
-
54
-
55
-
56
-
57
-
58
-
59
-
60
-
61
-
62
-
63
-
64
-
65
-
66
-
67
-
68
-
69
-
70
-
71
-
72
-
73
-
74
-
75
-
76
-
77
-
78
-
79
-
80
-
81
-
82
-
83
-
84
-
85
-
86
-
87
-
88
-
89
-
90
-
91
-
92
-
93
-
94
-
95
-
96
-
97
-
98
-
99
-
100
-
101
-
102
-
103
-
104
-
105
-
106
-
107
-
108
-
109
-
110
-
111
-
112
-
113
-
114
-
115
-
116
-
117
-
118
-
119
-
120
-
121
-
122
-
123
-
124
-
125
-
126
-
127
-
128
-
129
-
130
-
131
-
132
-
133
-
134
-
135
-
136
-
137
-
138
-
139
-
140
-
141
-
142
-
143
-
144
-
145
-
146
-
147
-
148
-
149
-
150
-
151
-
152
-
153
-
154
-
155
-
156
-
157
-
158
-
159
-
160
-
161
-
162
-
163
-
164
-
165
-
166
-
167
-
168
-
169
-
170
-
171
-
172
-
173
-
174
-
175
-
176
-
177
-
178
-
179
-
180
-
181
-
182
-
183
-
184
-
185
-
186
-
187
-
188
-
189
-
190
-
191
-
192
-
193
-
194
-
195
-
196
-
197
-
198
-
199
-
200
-
201
-
202
-
203
-
204
-
205
-
206
-
207
-
208
-
209
-
210
-
211
-
212
-
213
-
214
-
215
-
216
-
217
-
218
-
219
-
220
-
221
-
222
-
223
-
224
-
225
-
226
-
227
-
228
-
229
-
230
-
231
-
232
-
233
-
234
-
235
-
236
-
237
-
238
-
239
-
240
-
241
-
242
-
243
-
244
-
245
-
246
-
247
-
248
-
249
-
250
-
251
-
252
-
253
-
254
-
255
-
256
-
257
-
258
-
259
-
260
-
261
-
262
-
263
-
264
-
265
-
266
-
267
-
268
-
269
-
270
-
271
-
272
-
273
-
274
-
275
-
276
-
277
-
278
-
279
-
 280
280 -
 281
281 -
 282
282 -
 283
283 -
 284
284 -
 285
285 -
 286
286 -
 287
287 -
 288
288 -
 289
289 -
 290
290 -
 291
291 -
 292
292 -
 293
293 -
 294
294 -
 295
295 -
 296
296 -
 297
297 -
 298
298 -
 299
299 -
 300
300 -
301
-
302
-
303
-
304
-
305
-
306
-
307
-
308
-
309
-
310
-
311
-
312
-
313
-
314
-
315
-
316
-
317
-
318
-
319
-
320
-
321
-
322
-
323
-
324
-
325
-
326
-
327
-
328
-
329
-
330
-
331
-
332
-
333
-
334
-
335
-
336
-
337
-
338
-
339
-
340
-
341
-
342
-
343
-
344
-
345
-
346
-
347
-
348
-
349
-
350
-
351
-
352
-
353
-
354
-
355
-
356
-
357
-
358
-
359
-
360
-
361
-
362
-
363
-
364
-
365
-
366
-
367
-
368
-
369
-
370
-
371
-
372
-
373
-
374
-
375
-
376
-
377
-
378
-
379
-
380
-
381
-
382
-
383
-
384
-
385
-
386
-
387
-
388
-
389
-
390
-
391
-
392
-
393
-
394
-
395
-
396
-
397
-
398
-
399
-
400
-
401
-
402
-
403
-
404
-
405
-
406
-
407
-
408
-
409
-
410
-
411
-
412
-
413
-
414
-
415
-
416
-
417
-
418
-
419
-
420
-
421
-
422
-
423
-
424
-
425
-
426
-
427
-
428
-
429
-
430
-
431
-
432
-
433
-
434
-
435
-
436
-
437
-
438
-
439
-
440
-
441
-
442
-
443
-
444
-
445
-
446
-
447
-
448
-
449
-
450
-
451
-
452
-
453
-
454
-
455
-
456
-
457
-
458
-
459
-
460
-
461
-
462
-
463
-
464
-
465
-
466
-
467
-
468
-
469
-
470
-
471
-
472
-
473
-
474
-
475
-
476
 |
 |

HSBC HOLDINGS PLC
Report of the Directors: The Management of Risk (continued)
Capital management and allocation > Impact of Basel II / Biographies > Directors
288
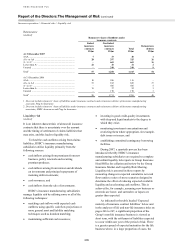
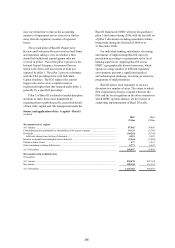
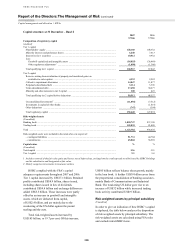
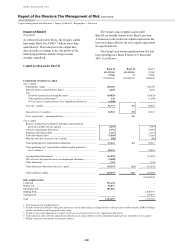
Impact of Basel II
(Unaudited)
As reflected in the table below, the Group’s capital
base under Basel II is US$19.7 billion lower than
under Basel I. This reduction in the capital base
does not reflect a change in the risk profile of the
underlying portfolios and the Group remains
strongly capitalised.
The Group’s risk-weighted assets under
Basel II are broadly similar to the Basel I position.
A reduction in the credit risk capital requirement has
been more than offset by the new capital requirement
for operational risk.
The Group’s pro-forma capital position if it had
been reporting on a Basel II basis at 31 December
2007 is as follows:
Capital position under Basel II
Basel II
pro-forma
Basel II
pro-forma
Basel I
Actual
US$m %1 US$m
(Unaudited) (Unaudited) (Audited)
Composition of regulatory capital
Tier 1 capital
Shareholders’ equity ..................................................................................... 128,160 128,160
Minority interests and preference shares ..................................................... 6,240 6,240
Less :
Goodwill capitalised and intangible assets .............................................. (38,855) (38,855)
Other regulatory adjustments2,3 ................................................................ 136 (1,090)
50% of excess of expected losses over impairment allowances ............. (4,508) –
Core tier 1 capital ......................................................................................... 91,173 8.1 94,455
Innovative tier 1 securities ........................................................................... 10,512 0.9 10,512
Tier 1 capital ratio – management basis ...................................................... 9.0
Tier 2 capital
Reserves arising from revaluation of property and unrealised
gains on available-for-sale equities ......................................................... 4,393 4,393
Collective impairment allowances4 .............................................................. 2,176 14,047
Perpetual subordinated debt ......................................................................... 3,114 3,114
Term subordinated debt ................................................................................ 37,658 37,658
Minority and other interests in tier 2 capital ................................................ 300 300
Total qualifying tier 2 capital before deductions ......................................... 47,641 4.2 59,512
Total qualifying tier 2 capital before deductions plus innovative
tier 1 securities ......................................................................................... 58,153 70,024
Unconsolidated investments5 ....................................................................... (11,092) (11,092)
50% of excess of expected losses over impairment allowances .................. (4,508) –
Other deductions .......................................................................................... (747) (747)
Total deductions other than from tier 1 capital ............................................ (16,347) (1.4) (11,839)
Total regulatory capital ................................................................................ 132,979 11.8 152,640
(Unaudited)
Risk-weighted assets
Credit risk ......................................................................................................... 976,138 –
Market risk ........................................................................................................ 45,847 –
Operational risk ................................................................................................ 107,466 –
Banking book .................................................................................................... – 1,020,747
Trading book ..................................................................................................... – 103,035
Total .................................................................................................................. 1,129,451 1,123,782
1 Percentage of risk-weighted assets.
2 Includes removal of the fair value gains and losses, net of deferred tax, arising from the credit spreads on debt issued by HSBC Holdings
and its subsidiaries and designated at fair value.
3 Includes a tax credit adjustment in respect of the excess of expected losses over impairment allowances.
4 Under Basel II, only collective impairment allowances on loan portfolios on the standardised approach are included in tier 2 capital.
5 Mainly comprises investments in insurance entities.