HSBC 2007 Annual Report Download - page 142
Download and view the complete annual report
Please find page 142 of the 2007 HSBC annual report below. You can navigate through the pages in the report by either clicking on the pages listed below, or by using the keyword search tool below to find specific information within the annual report.-
 1
1 -
2
-
3
-
4
-
5
-
6
-
7
-
8
-
9
-
10
-
11
-
12
-
13
-
14
-
15
-
16
-
17
-
18
-
19
-
20
-
21
-
22
-
23
-
24
-
25
-
26
-
27
-
28
-
29
-
30
-
31
-
32
-
33
-
34
-
35
-
36
-
37
-
38
-
39
-
40
-
41
-
42
-
43
-
44
-
45
-
46
-
47
-
48
-
49
-
50
-
51
-
52
-
53
-
54
-
55
-
56
-
57
-
58
-
59
-
60
-
61
-
62
-
63
-
64
-
65
-
66
-
67
-
68
-
69
-
70
-
71
-
72
-
73
-
74
-
75
-
76
-
77
-
78
-
79
-
80
-
81
-
82
-
83
-
84
-
85
-
86
-
87
-
88
-
89
-
90
-
91
-
92
-
93
-
94
-
95
-
96
-
97
-
98
-
99
-
100
-
101
-
102
-
103
-
104
-
105
-
106
-
107
-
108
-
109
-
110
-
111
-
112
-
113
-
114
-
115
-
116
-
117
-
118
-
119
-
120
-
121
-
122
-
123
-
124
-
125
-
126
-
127
-
128
-
129
-
130
-
131
-
 132
132 -
 133
133 -
 134
134 -
 135
135 -
 136
136 -
 137
137 -
 138
138 -
 139
139 -
 140
140 -
 141
141 -
 142
142 -
 143
143 -
 144
144 -
 145
145 -
 146
146 -
 147
147 -
 148
148 -
 149
149 -
 150
150 -
 151
151 -
 152
152 -
153
-
154
-
155
-
156
-
157
-
158
-
159
-
160
-
161
-
162
-
163
-
164
-
165
-
166
-
167
-
168
-
169
-
170
-
171
-
172
-
173
-
174
-
175
-
176
-
177
-
178
-
179
-
180
-
181
-
182
-
183
-
184
-
185
-
186
-
187
-
188
-
189
-
190
-
191
-
192
-
193
-
194
-
195
-
196
-
197
-
198
-
199
-
200
-
201
-
202
-
203
-
204
-
205
-
206
-
207
-
208
-
209
-
210
-
211
-
212
-
213
-
214
-
215
-
216
-
217
-
218
-
219
-
220
-
221
-
222
-
223
-
224
-
225
-
226
-
227
-
228
-
229
-
230
-
231
-
232
-
233
-
234
-
235
-
236
-
237
-
238
-
239
-
240
-
241
-
242
-
243
-
244
-
245
-
246
-
247
-
248
-
249
-
250
-
251
-
252
-
253
-
254
-
255
-
256
-
257
-
258
-
259
-
260
-
261
-
262
-
263
-
264
-
265
-
266
-
267
-
268
-
269
-
270
-
271
-
272
-
273
-
274
-
275
-
276
-
277
-
278
-
279
-
280
-
281
-
282
-
283
-
284
-
285
-
286
-
287
-
288
-
289
-
290
-
291
-
292
-
293
-
294
-
295
-
296
-
297
-
298
-
299
-
300
-
301
-
302
-
303
-
304
-
305
-
306
-
307
-
308
-
309
-
310
-
311
-
312
-
313
-
314
-
315
-
316
-
317
-
318
-
319
-
320
-
321
-
322
-
323
-
324
-
325
-
326
-
327
-
328
-
329
-
330
-
331
-
332
-
333
-
334
-
335
-
336
-
337
-
338
-
339
-
340
-
341
-
342
-
343
-
344
-
345
-
346
-
347
-
348
-
349
-
350
-
351
-
352
-
353
-
354
-
355
-
356
-
357
-
358
-
359
-
360
-
361
-
362
-
363
-
364
-
365
-
366
-
367
-
368
-
369
-
370
-
371
-
372
-
373
-
374
-
375
-
376
-
377
-
378
-
379
-
380
-
381
-
382
-
383
-
384
-
385
-
386
-
387
-
388
-
389
-
390
-
391
-
392
-
393
-
394
-
395
-
396
-
397
-
398
-
399
-
400
-
401
-
402
-
403
-
404
-
405
-
406
-
407
-
408
-
409
-
410
-
411
-
412
-
413
-
414
-
415
-
416
-
417
-
418
-
419
-
420
-
421
-
422
-
423
-
424
-
425
-
426
-
427
-
428
-
429
-
430
-
431
-
432
-
433
-
434
-
435
-
436
-
437
-
438
-
439
-
440
-
441
-
442
-
443
-
444
-
445
-
446
-
447
-
448
-
449
-
450
-
451
-
452
-
453
-
454
-
455
-
456
-
457
-
458
-
459
-
460
-
461
-
462
-
463
-
464
-
465
-
466
-
467
-
468
-
469
-
470
-
471
-
472
-
473
-
474
-
475
-
476
 |
 |

HSBC HOLDINGS PLC
Report of the Directors: Financial Review (continued)
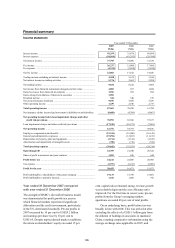
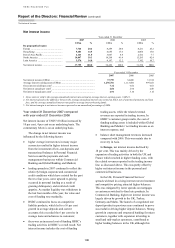
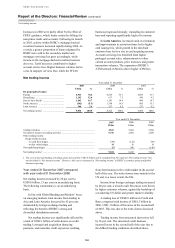
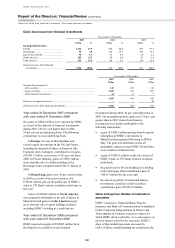
Net interest income / Net fee income
140
Year ended 31 December 2006 compared
with year ended 31 December 2005
Net interest income of US$34.5 billion was 10 per
cent higher than in 2005 and 7 per cent higher on an
underlying basis. The commentary that follows is on
an underlying basis.
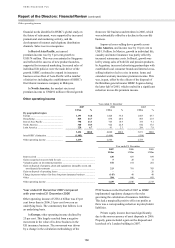
Movements in net interest income were
particularly influenced by the following factors:
• rising short-term interest rates in US dollars and
linked currencies, and in sterling, increased the
value of low-cost deposits and transactional
balances and increased the interest income
earned from investing those balances. This was
particularly relevant to the Personal Financial
Services and Commercial Banking businesses in
Asia and the UK, and also improved the value
of cash balances within the Group’s custody and
payments and cash management businesses and
increased the resultant investment income;
• the cumulative effect of higher short-term
interest rates in most major currencies in recent
years has been to flatten interest rate yield
curves and to reduce the opportunities available
to HSBC’s balance sheet management
operations to generate additional income. This
reduced growth in net interest income compared
with 2005 by some 2 percentage points;
• strong liquidity and benign credit conditions put
pressure on lending margins in corporate and
commercial banking and credit spreads
tightened as a consequence. Increased
competition for core deposits also reduced
deposit spreads in certain markets;
• HSBC deployed an increased proportion of
liabilities into trading assets. Reported net
interest income includes the cost of internally
funding these assets, while related revenue is
included in trading income. This was
particularly relevant to the UK, France and the
US. The cost of funding net long positions is
included within trading as an interest expense in
HSBC’s customer group reporting; and
• HSBC concentrated balance sheet expansion on
attracting liabilities and, as a result, customer
deposits, at constant currency but including
acquisitions, grew by 3 percentage points more
than customer loans.
In Europe, net interest income increased by
1 per cent. The benefit of balance growth in Personal
Financial Services and Commercial Banking was
substantially offset by the increased deployment of
liabilities to the fund trading activity referred to
above; there was a corresponding rise in trading
income. This was most pronounced in the UK and
France.
In the UK, growth in Personal Financial
Services was strong in savings and packaged current
accounts, but mortgage and credit card lending also
increased. In Commercial Banking, customer
recruitment boosted growth in deposit balances and
spreads widened, particularly on US dollar
denominated accounts. Commercial lending balances
were higher, in part reflecting the strong growth
throughout 2005. In France, revenues declined
despite growth in lending, due to competitive pricing
pressures and the impact of older, higher-yielding
hedges of the network’s funding surplus maturing.
Global Banking and Markets’ balance sheet
management revenues declined as the rising trend in
short-term interest rates continued to flatten yield
curves.
In Hong Kong, net interest income rose by
15 per cent. Deposit spreads widened with
progressive interest rate rises, and balances increased
as customers took advantage of higher rates. HSBC
supported this growth with a number of promotions
and marketing campaigns during the year. In
Personal Financial Services, average savings and
deposit balances rose by 7 per cent. The launch of a
simplified mortgage pricing structure helped boost
mortgage balances and grow market share. A clear
focus on sales and targeted marketing helped achieve
strong growth in credit card balances, and the
number of cards in issue rose by 17 per cent to
4.6 million. Average corporate lending balances rose
as the economy gained momentum and investment
was channelled into mainland China. The benefit of
these developments, however, was substantially
offset by spread compression through the rising cost
of funds, and lower balance sheet management
revenues as short-term interest rates continued to
rise, and yield curves remained flat.
In Rest of Asia-Pacific, a 25 per cent rise in net
interest income was fuelled by balance sheet growth
in Personal Financial Services and Commercial
Banking. This reflected HSBC’s continuing
investment in growing the business through network
expansion, customer recruitment and targeted
marketing and promotions. In Personal Financial
Services, the emphasis on the recruitment of HSBC
Premier customers generated strong deposit growth
throughout the region, which funded increased
mortgage and credit card borrowing. Other
unsecured lending balances also grew significantly,
as HSBC expanded its consumer finance operations
in India, Australia and Indonesia. In corporate and
commercial banking, increased deposits raised