HSBC 2007 Annual Report Download - page 259
Download and view the complete annual report
Please find page 259 of the 2007 HSBC annual report below. You can navigate through the pages in the report by either clicking on the pages listed below, or by using the keyword search tool below to find specific information within the annual report.-
 1
1 -
2
-
3
-
4
-
5
-
6
-
7
-
8
-
9
-
10
-
11
-
12
-
13
-
14
-
15
-
16
-
17
-
18
-
19
-
20
-
21
-
22
-
23
-
24
-
25
-
26
-
27
-
28
-
29
-
30
-
31
-
32
-
33
-
34
-
35
-
36
-
37
-
38
-
39
-
40
-
41
-
42
-
43
-
44
-
45
-
46
-
47
-
48
-
49
-
50
-
51
-
52
-
53
-
54
-
55
-
56
-
57
-
58
-
59
-
60
-
61
-
62
-
63
-
64
-
65
-
66
-
67
-
68
-
69
-
70
-
71
-
72
-
73
-
74
-
75
-
76
-
77
-
78
-
79
-
80
-
81
-
82
-
83
-
84
-
85
-
86
-
87
-
88
-
89
-
90
-
91
-
92
-
93
-
94
-
95
-
96
-
97
-
98
-
99
-
100
-
101
-
102
-
103
-
104
-
105
-
106
-
107
-
108
-
109
-
110
-
111
-
112
-
113
-
114
-
115
-
116
-
117
-
118
-
119
-
120
-
121
-
122
-
123
-
124
-
125
-
126
-
127
-
128
-
129
-
130
-
131
-
132
-
133
-
134
-
135
-
136
-
137
-
138
-
139
-
140
-
141
-
142
-
143
-
144
-
145
-
146
-
147
-
148
-
149
-
150
-
151
-
152
-
153
-
154
-
155
-
156
-
157
-
158
-
159
-
160
-
161
-
162
-
163
-
164
-
165
-
166
-
167
-
168
-
169
-
170
-
171
-
172
-
173
-
174
-
175
-
176
-
177
-
178
-
179
-
180
-
181
-
182
-
183
-
184
-
185
-
186
-
187
-
188
-
189
-
190
-
191
-
192
-
193
-
194
-
195
-
196
-
197
-
198
-
199
-
200
-
201
-
202
-
203
-
204
-
205
-
206
-
207
-
208
-
209
-
210
-
211
-
212
-
213
-
214
-
215
-
216
-
217
-
218
-
219
-
220
-
221
-
222
-
223
-
224
-
225
-
226
-
227
-
228
-
229
-
230
-
231
-
232
-
233
-
234
-
235
-
236
-
237
-
238
-
239
-
240
-
241
-
242
-
243
-
244
-
245
-
246
-
247
-
248
-
 249
249 -
 250
250 -
 251
251 -
 252
252 -
 253
253 -
 254
254 -
 255
255 -
 256
256 -
 257
257 -
 258
258 -
 259
259 -
 260
260 -
 261
261 -
 262
262 -
 263
263 -
 264
264 -
 265
265 -
 266
266 -
 267
267 -
 268
268 -
 269
269 -
270
-
271
-
272
-
273
-
274
-
275
-
276
-
277
-
278
-
279
-
280
-
281
-
282
-
283
-
284
-
285
-
286
-
287
-
288
-
289
-
290
-
291
-
292
-
293
-
294
-
295
-
296
-
297
-
298
-
299
-
300
-
301
-
302
-
303
-
304
-
305
-
306
-
307
-
308
-
309
-
310
-
311
-
312
-
313
-
314
-
315
-
316
-
317
-
318
-
319
-
320
-
321
-
322
-
323
-
324
-
325
-
326
-
327
-
328
-
329
-
330
-
331
-
332
-
333
-
334
-
335
-
336
-
337
-
338
-
339
-
340
-
341
-
342
-
343
-
344
-
345
-
346
-
347
-
348
-
349
-
350
-
351
-
352
-
353
-
354
-
355
-
356
-
357
-
358
-
359
-
360
-
361
-
362
-
363
-
364
-
365
-
366
-
367
-
368
-
369
-
370
-
371
-
372
-
373
-
374
-
375
-
376
-
377
-
378
-
379
-
380
-
381
-
382
-
383
-
384
-
385
-
386
-
387
-
388
-
389
-
390
-
391
-
392
-
393
-
394
-
395
-
396
-
397
-
398
-
399
-
400
-
401
-
402
-
403
-
404
-
405
-
406
-
407
-
408
-
409
-
410
-
411
-
412
-
413
-
414
-
415
-
416
-
417
-
418
-
419
-
420
-
421
-
422
-
423
-
424
-
425
-
426
-
427
-
428
-
429
-
430
-
431
-
432
-
433
-
434
-
435
-
436
-
437
-
438
-
439
-
440
-
441
-
442
-
443
-
444
-
445
-
446
-
447
-
448
-
449
-
450
-
451
-
452
-
453
-
454
-
455
-
456
-
457
-
458
-
459
-
460
-
461
-
462
-
463
-
464
-
465
-
466
-
467
-
468
-
469
-
470
-
471
-
472
-
473
-
474
-
475
-
476
 |
 |
257
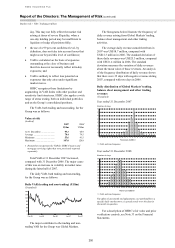
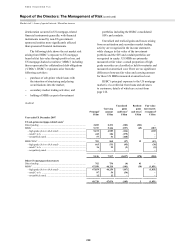
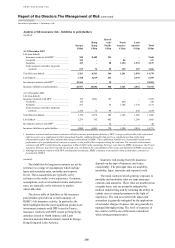
Total VAR arising within HSBC Holdings in
2007 and 2006 was as follows:
Value at risk – HSBC Holdings
(Audited)
Foreign
exchange
US$m
Interest
rates
US$m
Total
US$m
At 31 December 2007 49.1 97.7 105.0
At 31 December 2006 30.8 61.4 66.4
Average
2007 ...................... 33.6 66.0 68.1
2006 ...................... 27.4 43.6 49.2
Minimum
2007 ...................... 29.2 52.7 53.3
2006 ...................... 23.2 30.7 34.8
Maximum
2007 ...................... 49.1 97.7 105.0
2006 ...................... 32.0 61.4 66.4
The increase in total VAR during 2007 was
mainly due to the increase in volatility of interest
rates and new debt capital issues made in the year.
(Unaudited)
A principal tool in the management of market
risk is the projected sensitivity of HSBC Holdings’
net interest income to future changes in yield
curves.
The table below sets out the effect on HSBC
Holdings’ future net interest income of an
incremental 25 basis point parallel fall or rise in all
yield curves worldwide at the beginning of each
quarter during the 12 months from 1 January 2008.
Assuming no management action, a series
of such rises would decrease HSBC Holdings’
planned net interest income for 2008 by
US$23 million (2007: increase of US$8 million)
while a series of such falls would increase
planned net interest income by US$23 million
(2007: decrease of US$8 million). These figures
incorporate the impact of any option features in
the underlying exposures.
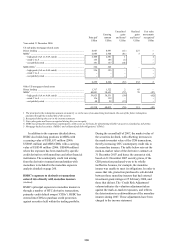
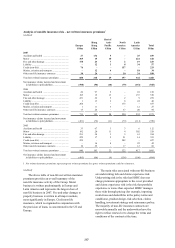
Instead of assuming that all interest rates move
together, HSBC groups its interest rate exposures
into currency blocs whose interest rates are
considered likely to move together. The sensitivity
of projected net interest income, on this basis, is
described as follows:
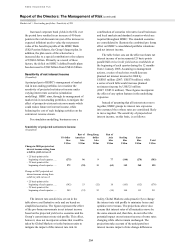
Sensitivity of HSBC Holdings’ net interest income to interest rate movements
(Unaudited)
US dollar
bloc
Sterling
bloc
Euro
bloc
Total
US$m US$m US$m US$m
Change in 2008 projected net interest income arising
from a shift in yield curves of:
+ 25 basis points at the beginning of each quarter .. (51) 16 12 (23)
– 25 basis points at the beginning of each quarter .. 51 (16) (12) 23
Change in 2007 projected net interest income arising
from a shift in yield curves of:
+ 25 basis points at the beginning of each quarter .. (7) 6 9 8
– 25 basis points at the beginning of each quarter .. 7 (6) (9) (8)
HSBC Holdings’ principal exposure to changes
in its net interest income from movements in interest
rates arises on short-term cash balances, floating rate
loans advanced to subsidiaries and fixed rate debt
capital securities in issue which have been swapped
to floating rate.
The interest rate sensitivities tabulated above
are illustrative only and are based on simplified
scenarios. The figures represent the effect of
pro forma movements in net interest income based
on the projected yield curve scenarios and HSBC
Holdings’ current interest rate risk profile. They do
not take into account the effect of actions that could
be taken to mitigate this interest rate risk, however.
The projected increase in HSBC Holdings’
sensitivity to moves in interest rates is mainly due to
new interest-bearing capital issues, the funds from
which have been largely invested in non-interest
bearing equity investments in subsidiaries.
Areas of special interest – market risk
(Audited)
In the second half of 2007, credit risk concerns
emanating from the US sub-prime mortgage market
led to a deterioration in the fair value of assets
supported by sub-prime mortgages. However, there
was a consequential impact beyond sub-prime
related assets and, to a lesser degree, fair value