HSBC 2007 Annual Report Download - page 389
Download and view the complete annual report
Please find page 389 of the 2007 HSBC annual report below. You can navigate through the pages in the report by either clicking on the pages listed below, or by using the keyword search tool below to find specific information within the annual report.-
 1
1 -
2
-
3
-
4
-
5
-
6
-
7
-
8
-
9
-
10
-
11
-
12
-
13
-
14
-
15
-
16
-
17
-
18
-
19
-
20
-
21
-
22
-
23
-
24
-
25
-
26
-
27
-
28
-
29
-
30
-
31
-
32
-
33
-
34
-
35
-
36
-
37
-
38
-
39
-
40
-
41
-
42
-
43
-
44
-
45
-
46
-
47
-
48
-
49
-
50
-
51
-
52
-
53
-
54
-
55
-
56
-
57
-
58
-
59
-
60
-
61
-
62
-
63
-
64
-
65
-
66
-
67
-
68
-
69
-
70
-
71
-
72
-
73
-
74
-
75
-
76
-
77
-
78
-
79
-
80
-
81
-
82
-
83
-
84
-
85
-
86
-
87
-
88
-
89
-
90
-
91
-
92
-
93
-
94
-
95
-
96
-
97
-
98
-
99
-
100
-
101
-
102
-
103
-
104
-
105
-
106
-
107
-
108
-
109
-
110
-
111
-
112
-
113
-
114
-
115
-
116
-
117
-
118
-
119
-
120
-
121
-
122
-
123
-
124
-
125
-
126
-
127
-
128
-
129
-
130
-
131
-
132
-
133
-
134
-
135
-
136
-
137
-
138
-
139
-
140
-
141
-
142
-
143
-
144
-
145
-
146
-
147
-
148
-
149
-
150
-
151
-
152
-
153
-
154
-
155
-
156
-
157
-
158
-
159
-
160
-
161
-
162
-
163
-
164
-
165
-
166
-
167
-
168
-
169
-
170
-
171
-
172
-
173
-
174
-
175
-
176
-
177
-
178
-
179
-
180
-
181
-
182
-
183
-
184
-
185
-
186
-
187
-
188
-
189
-
190
-
191
-
192
-
193
-
194
-
195
-
196
-
197
-
198
-
199
-
200
-
201
-
202
-
203
-
204
-
205
-
206
-
207
-
208
-
209
-
210
-
211
-
212
-
213
-
214
-
215
-
216
-
217
-
218
-
219
-
220
-
221
-
222
-
223
-
224
-
225
-
226
-
227
-
228
-
229
-
230
-
231
-
232
-
233
-
234
-
235
-
236
-
237
-
238
-
239
-
240
-
241
-
242
-
243
-
244
-
245
-
246
-
247
-
248
-
249
-
250
-
251
-
252
-
253
-
254
-
255
-
256
-
257
-
258
-
259
-
260
-
261
-
262
-
263
-
264
-
265
-
266
-
267
-
268
-
269
-
270
-
271
-
272
-
273
-
274
-
275
-
276
-
277
-
278
-
279
-
280
-
281
-
282
-
283
-
284
-
285
-
286
-
287
-
288
-
289
-
290
-
291
-
292
-
293
-
294
-
295
-
296
-
297
-
298
-
299
-
300
-
301
-
302
-
303
-
304
-
305
-
306
-
307
-
308
-
309
-
310
-
311
-
312
-
313
-
314
-
315
-
316
-
317
-
318
-
319
-
320
-
321
-
322
-
323
-
324
-
325
-
326
-
327
-
328
-
329
-
330
-
331
-
332
-
333
-
334
-
335
-
336
-
337
-
338
-
339
-
340
-
341
-
342
-
343
-
344
-
345
-
346
-
347
-
348
-
349
-
350
-
351
-
352
-
353
-
354
-
355
-
356
-
357
-
358
-
359
-
360
-
361
-
362
-
363
-
364
-
365
-
366
-
367
-
368
-
369
-
370
-
371
-
372
-
373
-
374
-
375
-
376
-
377
-
378
-
 379
379 -
 380
380 -
 381
381 -
 382
382 -
 383
383 -
 384
384 -
 385
385 -
 386
386 -
 387
387 -
 388
388 -
 389
389 -
 390
390 -
 391
391 -
 392
392 -
 393
393 -
 394
394 -
 395
395 -
 396
396 -
 397
397 -
 398
398 -
 399
399 -
400
-
401
-
402
-
403
-
404
-
405
-
406
-
407
-
408
-
409
-
410
-
411
-
412
-
413
-
414
-
415
-
416
-
417
-
418
-
419
-
420
-
421
-
422
-
423
-
424
-
425
-
426
-
427
-
428
-
429
-
430
-
431
-
432
-
433
-
434
-
435
-
436
-
437
-
438
-
439
-
440
-
441
-
442
-
443
-
444
-
445
-
446
-
447
-
448
-
449
-
450
-
451
-
452
-
453
-
454
-
455
-
456
-
457
-
458
-
459
-
460
-
461
-
462
-
463
-
464
-
465
-
466
-
467
-
468
-
469
-
470
-
471
-
472
-
473
-
474
-
475
-
476
 |
 |

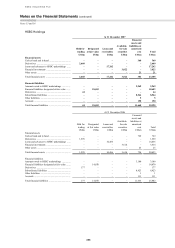
387
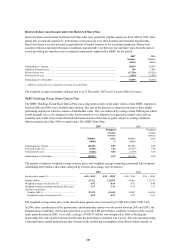
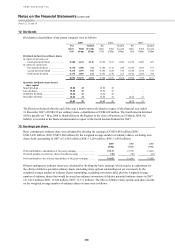
Number of shares (millions)
2007 2006 2005
Average number of shares in issue .................................................................. 11,545 11,210 11,038
Dilutive share options and share awards ......................................................... 116 110 133
– Savings-related Share Option Plan ........................................................... 20 27 22
– Executive Share Option Scheme .............................................................. 5 10 11
– Group Share Option Plan ......................................................................... 16 28 14
– Restricted and performance share awards ................................................ 67 32 70
– HSBC France share options ..................................................................... 5 8 10
– HSBC Finance share options ................................................................... 3 5 6
Average number of shares in issue assuming dilution .................................... 11,661 11,320 11,171
Of the total number of employee share options and share awards existing at 31 December 2007, 19 million were anti-
dilutive (2006: 20 million; 2005: 121 million).
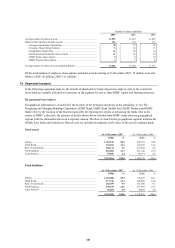
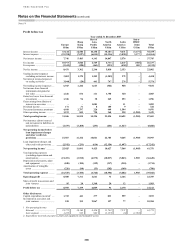
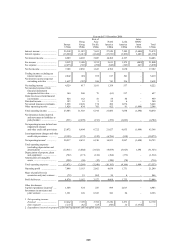
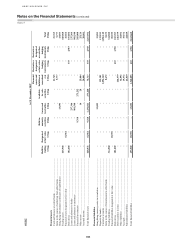
14 Segmental analysis
In the following segmental analysis, the benefit of shareholders’ funds impacts the analysis only to the extent that
these funds are actually allocated to businesses in the segment by way of intra-HSBC capital and funding structures.
By geographical region
Geographical information is classified by the location of the principal operations of the subsidiary, or, for The
Hongkong and Shanghai Banking Corporation, HSBC Bank, HSBC Bank Middle East, HSBC Finance and HSBC
Bank USA, by the location of the branch responsible for reporting the results or advancing the funds. Due to the
nature of HSBC’s structure, the analysis of profits shown below includes intra-HSBC items between geographical
regions with the elimination shown in a separate column. The Rest of Asia-Pacific geographical segment includes the
Middle East, India and Australasia. Shared costs are included in segments on the basis of the actual recharges made.
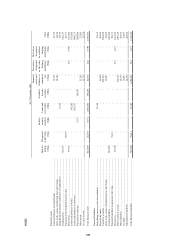
Total assets
At 31 December 2007 At 31 December 2006
US$m % US$m %
Europe .............................................................................................................. 1,184,315 50.3 828,701 44.6
Hong Kong ....................................................................................................... 332,691 14.1 272,428 14.6
Rest of Asia-Pacific ......................................................................................... 228,112 9.7 167,668 9.0
North America ................................................................................................. 510,092 21.7 511,190 27.5
Latin America .................................................................................................. 99,056 4.2 80,771 4.3
2,354,266 100.0 1,860,758 100.0
Total liabilities
At 31 December 2007 At 31 December 2006
US$m % US$m %
Europe .............................................................................................................. 1,126,508 50.7 778,635 44.7
Hong Kong ....................................................................................................... 317,316 14.3 258,028 14.8
Rest of Asia-Pacific ......................................................................................... 210,499 9.5 161,388 9.2
North America ................................................................................................. 478,323 21.6 477,310 27.3
Latin America .................................................................................................. 86,204 3.9 70,469 4.0
2,218,850 100.0 1,745,830 100.0