HSBC 2007 Annual Report Download - page 256
Download and view the complete annual report
Please find page 256 of the 2007 HSBC annual report below. You can navigate through the pages in the report by either clicking on the pages listed below, or by using the keyword search tool below to find specific information within the annual report.-
 1
1 -
2
-
3
-
4
-
5
-
6
-
7
-
8
-
9
-
10
-
11
-
12
-
13
-
14
-
15
-
16
-
17
-
18
-
19
-
20
-
21
-
22
-
23
-
24
-
25
-
26
-
27
-
28
-
29
-
30
-
31
-
32
-
33
-
34
-
35
-
36
-
37
-
38
-
39
-
40
-
41
-
42
-
43
-
44
-
45
-
46
-
47
-
48
-
49
-
50
-
51
-
52
-
53
-
54
-
55
-
56
-
57
-
58
-
59
-
60
-
61
-
62
-
63
-
64
-
65
-
66
-
67
-
68
-
69
-
70
-
71
-
72
-
73
-
74
-
75
-
76
-
77
-
78
-
79
-
80
-
81
-
82
-
83
-
84
-
85
-
86
-
87
-
88
-
89
-
90
-
91
-
92
-
93
-
94
-
95
-
96
-
97
-
98
-
99
-
100
-
101
-
102
-
103
-
104
-
105
-
106
-
107
-
108
-
109
-
110
-
111
-
112
-
113
-
114
-
115
-
116
-
117
-
118
-
119
-
120
-
121
-
122
-
123
-
124
-
125
-
126
-
127
-
128
-
129
-
130
-
131
-
132
-
133
-
134
-
135
-
136
-
137
-
138
-
139
-
140
-
141
-
142
-
143
-
144
-
145
-
146
-
147
-
148
-
149
-
150
-
151
-
152
-
153
-
154
-
155
-
156
-
157
-
158
-
159
-
160
-
161
-
162
-
163
-
164
-
165
-
166
-
167
-
168
-
169
-
170
-
171
-
172
-
173
-
174
-
175
-
176
-
177
-
178
-
179
-
180
-
181
-
182
-
183
-
184
-
185
-
186
-
187
-
188
-
189
-
190
-
191
-
192
-
193
-
194
-
195
-
196
-
197
-
198
-
199
-
200
-
201
-
202
-
203
-
204
-
205
-
206
-
207
-
208
-
209
-
210
-
211
-
212
-
213
-
214
-
215
-
216
-
217
-
218
-
219
-
220
-
221
-
222
-
223
-
224
-
225
-
226
-
227
-
228
-
229
-
230
-
231
-
232
-
233
-
234
-
235
-
236
-
237
-
238
-
239
-
240
-
241
-
242
-
243
-
244
-
245
-
 246
246 -
 247
247 -
 248
248 -
 249
249 -
 250
250 -
 251
251 -
 252
252 -
 253
253 -
 254
254 -
 255
255 -
 256
256 -
 257
257 -
 258
258 -
 259
259 -
 260
260 -
 261
261 -
 262
262 -
 263
263 -
 264
264 -
 265
265 -
 266
266 -
267
-
268
-
269
-
270
-
271
-
272
-
273
-
274
-
275
-
276
-
277
-
278
-
279
-
280
-
281
-
282
-
283
-
284
-
285
-
286
-
287
-
288
-
289
-
290
-
291
-
292
-
293
-
294
-
295
-
296
-
297
-
298
-
299
-
300
-
301
-
302
-
303
-
304
-
305
-
306
-
307
-
308
-
309
-
310
-
311
-
312
-
313
-
314
-
315
-
316
-
317
-
318
-
319
-
320
-
321
-
322
-
323
-
324
-
325
-
326
-
327
-
328
-
329
-
330
-
331
-
332
-
333
-
334
-
335
-
336
-
337
-
338
-
339
-
340
-
341
-
342
-
343
-
344
-
345
-
346
-
347
-
348
-
349
-
350
-
351
-
352
-
353
-
354
-
355
-
356
-
357
-
358
-
359
-
360
-
361
-
362
-
363
-
364
-
365
-
366
-
367
-
368
-
369
-
370
-
371
-
372
-
373
-
374
-
375
-
376
-
377
-
378
-
379
-
380
-
381
-
382
-
383
-
384
-
385
-
386
-
387
-
388
-
389
-
390
-
391
-
392
-
393
-
394
-
395
-
396
-
397
-
398
-
399
-
400
-
401
-
402
-
403
-
404
-
405
-
406
-
407
-
408
-
409
-
410
-
411
-
412
-
413
-
414
-
415
-
416
-
417
-
418
-
419
-
420
-
421
-
422
-
423
-
424
-
425
-
426
-
427
-
428
-
429
-
430
-
431
-
432
-
433
-
434
-
435
-
436
-
437
-
438
-
439
-
440
-
441
-
442
-
443
-
444
-
445
-
446
-
447
-
448
-
449
-
450
-
451
-
452
-
453
-
454
-
455
-
456
-
457
-
458
-
459
-
460
-
461
-
462
-
463
-
464
-
465
-
466
-
467
-
468
-
469
-
470
-
471
-
472
-
473
-
474
-
475
-
476
 |
 |

HSBC HOLDINGS PLC
Report of the Directors: The Management of Risk (continued)
Market risk > Non-trading portfolios / Sensitivity of NII
254
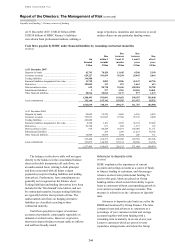
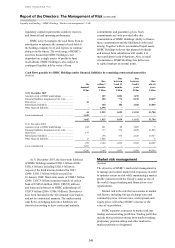
Increased corporate bond yields in the UK over
the period have resulted in an increase of 40 basis
points in the real discount rate (net of the increase in
expected inflation) used to value the net present
value of the benefits payable of the HSBC Bank
(UK) Pension Scheme, the Group’s largest plan. In
addition, the plan assets of the scheme have
increased due to a special contribution to the scheme
of US$0.6 billion. Primarily as a result of these
factors, the deficit on HSBC’s defined benefit plans
has decreased to US$2 billion from US$4.6 billion.
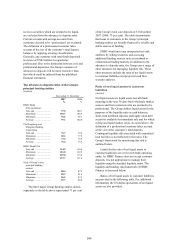
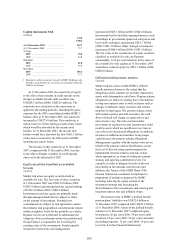
Sensitivity of net interest income
(Unaudited)
A principal part of HSBC’s management of market
risk in non-trading portfolios is to monitor the
sensitivity of projected net interest income under
varying interest rate scenarios (simulation
modelling). HSBC aims, through its management of
market risk in non-trading portfolios, to mitigate the
effect of prospective interest rate movements which
could reduce future net interest income, while
balancing the cost of such hedging activities on the
current net revenue stream.
For simulation modelling, businesses use a
combination of scenarios relevant to local businesses
and local markets and standard scenarios which are
required throughout HSBC. The standard scenarios
are consolidated to illustrate the combined pro forma
effect on HSBC’s consolidated portfolio valuations
and net interest income.
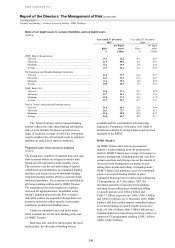
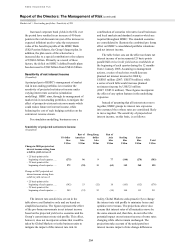
The table below sets out the effect on future net
interest income of an incremental 25 basis points
parallel fall or rise in all yield curves worldwide at
the beginning of each quarter during the 12 months
from 1 January 2008. Assuming no management
actions, a series of such rises would decrease
planned net interest income for 2008 by
US$503 million (2007: US$578 million), while
a series of such falls would increase planned
net interest income by US$525 million
(2007: US$511 million). These figures incorporate
the effect of any option features in the underlying
exposures.
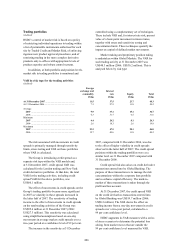
Instead of assuming that all interest rates move
together, HSBC groups its interest rate exposures
into currency blocs whose rates are considered likely
to move together. The sensitivity of projected net
interest income, on this basis, is as follows:
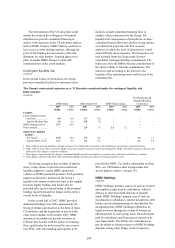
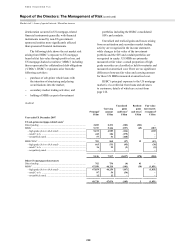
Sensitivity of projected net interest income
(Unaudited)
US dollar
bloc
US$m
Rest of
Americas
bloc
US$m
Hong Kong
dollar
bloc
US$m
Rest of
Asia
bloc
US$m
Sterling
bloc
US$m
Euro
bloc
US$m
Total
US$m
Change in 2008 projected net
interest income arising from
a shift in yield curves of:
+ 25 basis points at the
beginning of each quarter ..... (275) 96 9 77 (140) (270) (503)
– 25 basis points at the
beginning of each quarter ..... 272 (95) 11 (65) 142 260 525
Change in 2007 projected net
interest income arising from
a shift in yield curves of:
+ 25 basis points at the
beginning of each quarter ..... (342) 53 (32) 18 (163) (112) (578)
– 25 basis points at the
beginning of each quarter ..... 249 (53) 52 (14) 164 113 511
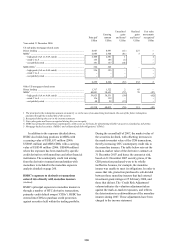
The interest rate sensitivities set out in the
table above are illustrative only and are based on
simplified scenarios. The figures represent the effect
of the pro-forma movements in net interest income
based on the projected yield curve scenarios and the
Group’s current interest rate risk profile. This effect,
however, does not incorporate actions that would be
taken by Global Markets or in the business units to
mitigate the impact of this interest rate risk. In
reality, Global Markets seeks proactively to change
the interest rate risk profile to minimise losses and
optimise net revenues. The projections above also
assume that interest rates of all maturities move by
the same amount and, therefore, do not reflect the
potential impact on net interest income of some rates
changing while others remain unchanged. The
projections take account of the anticipated net
interest income impact of rate change differences