HSBC 2007 Annual Report Download - page 228
Download and view the complete annual report
Please find page 228 of the 2007 HSBC annual report below. You can navigate through the pages in the report by either clicking on the pages listed below, or by using the keyword search tool below to find specific information within the annual report.-
 1
1 -
2
-
3
-
4
-
5
-
6
-
7
-
8
-
9
-
10
-
11
-
12
-
13
-
14
-
15
-
16
-
17
-
18
-
19
-
20
-
21
-
22
-
23
-
24
-
25
-
26
-
27
-
28
-
29
-
30
-
31
-
32
-
33
-
34
-
35
-
36
-
37
-
38
-
39
-
40
-
41
-
42
-
43
-
44
-
45
-
46
-
47
-
48
-
49
-
50
-
51
-
52
-
53
-
54
-
55
-
56
-
57
-
58
-
59
-
60
-
61
-
62
-
63
-
64
-
65
-
66
-
67
-
68
-
69
-
70
-
71
-
72
-
73
-
74
-
75
-
76
-
77
-
78
-
79
-
80
-
81
-
82
-
83
-
84
-
85
-
86
-
87
-
88
-
89
-
90
-
91
-
92
-
93
-
94
-
95
-
96
-
97
-
98
-
99
-
100
-
101
-
102
-
103
-
104
-
105
-
106
-
107
-
108
-
109
-
110
-
111
-
112
-
113
-
114
-
115
-
116
-
117
-
118
-
119
-
120
-
121
-
122
-
123
-
124
-
125
-
126
-
127
-
128
-
129
-
130
-
131
-
132
-
133
-
134
-
135
-
136
-
137
-
138
-
139
-
140
-
141
-
142
-
143
-
144
-
145
-
146
-
147
-
148
-
149
-
150
-
151
-
152
-
153
-
154
-
155
-
156
-
157
-
158
-
159
-
160
-
161
-
162
-
163
-
164
-
165
-
166
-
167
-
168
-
169
-
170
-
171
-
172
-
173
-
174
-
175
-
176
-
177
-
178
-
179
-
180
-
181
-
182
-
183
-
184
-
185
-
186
-
187
-
188
-
189
-
190
-
191
-
192
-
193
-
194
-
195
-
196
-
197
-
198
-
199
-
200
-
201
-
202
-
203
-
204
-
205
-
206
-
207
-
208
-
209
-
210
-
211
-
212
-
213
-
214
-
215
-
216
-
217
-
 218
218 -
 219
219 -
 220
220 -
 221
221 -
 222
222 -
 223
223 -
 224
224 -
 225
225 -
 226
226 -
 227
227 -
 228
228 -
 229
229 -
 230
230 -
 231
231 -
 232
232 -
 233
233 -
 234
234 -
 235
235 -
 236
236 -
 237
237 -
 238
238 -
239
-
240
-
241
-
242
-
243
-
244
-
245
-
246
-
247
-
248
-
249
-
250
-
251
-
252
-
253
-
254
-
255
-
256
-
257
-
258
-
259
-
260
-
261
-
262
-
263
-
264
-
265
-
266
-
267
-
268
-
269
-
270
-
271
-
272
-
273
-
274
-
275
-
276
-
277
-
278
-
279
-
280
-
281
-
282
-
283
-
284
-
285
-
286
-
287
-
288
-
289
-
290
-
291
-
292
-
293
-
294
-
295
-
296
-
297
-
298
-
299
-
300
-
301
-
302
-
303
-
304
-
305
-
306
-
307
-
308
-
309
-
310
-
311
-
312
-
313
-
314
-
315
-
316
-
317
-
318
-
319
-
320
-
321
-
322
-
323
-
324
-
325
-
326
-
327
-
328
-
329
-
330
-
331
-
332
-
333
-
334
-
335
-
336
-
337
-
338
-
339
-
340
-
341
-
342
-
343
-
344
-
345
-
346
-
347
-
348
-
349
-
350
-
351
-
352
-
353
-
354
-
355
-
356
-
357
-
358
-
359
-
360
-
361
-
362
-
363
-
364
-
365
-
366
-
367
-
368
-
369
-
370
-
371
-
372
-
373
-
374
-
375
-
376
-
377
-
378
-
379
-
380
-
381
-
382
-
383
-
384
-
385
-
386
-
387
-
388
-
389
-
390
-
391
-
392
-
393
-
394
-
395
-
396
-
397
-
398
-
399
-
400
-
401
-
402
-
403
-
404
-
405
-
406
-
407
-
408
-
409
-
410
-
411
-
412
-
413
-
414
-
415
-
416
-
417
-
418
-
419
-
420
-
421
-
422
-
423
-
424
-
425
-
426
-
427
-
428
-
429
-
430
-
431
-
432
-
433
-
434
-
435
-
436
-
437
-
438
-
439
-
440
-
441
-
442
-
443
-
444
-
445
-
446
-
447
-
448
-
449
-
450
-
451
-
452
-
453
-
454
-
455
-
456
-
457
-
458
-
459
-
460
-
461
-
462
-
463
-
464
-
465
-
466
-
467
-
468
-
469
-
470
-
471
-
472
-
473
-
474
-
475
-
476
 |
 |

HSBC HOLDINGS PLC
Report of the Directors: The Management of Risk (continued)
Credit risk > Credit quality > Loans and advances > 2007 / Renegotiated loans
226
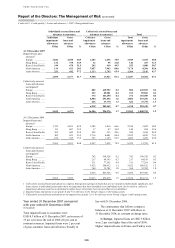
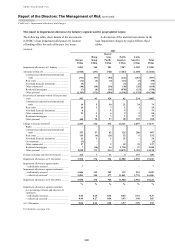
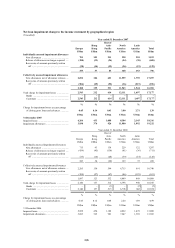
Individually assessed loans and
advances to customers
Collectively assessed loans and
advances to customers1 Total
Individual
impairment
allowances
Gross
loans and
advances
Collective
impairment
allowances
Gross
loans and
advances
Total
impairment
allowances
Gross
loans and
advances
US$m US$m % US$m US$m % US$m US$m %
At 31 December 2007
Impaired loans and
advances2
Europe ................... 1,846 4,558 40.5 1,203 1,696 70.9 3,049 6,254 48.8
Hong Kong ............ 132 378 34.9 12 55 21.8 144 433 33.3
Rest of Asia-Pacific 349 678 51.5 203 410 49.5 552 1,088 50.7
North America ....... 119 421 28.3 7,057 7,963 88.6 7,176 8,384 85.6
Latin America ........ 253 442 57.2 1,113 1,703 65.4 1,366 2,145 63.7
2,699 6,477 41.7 9,588 11,827 81.1 12,287 18,304 67.1
Collectively assessed
loans and advances
not impaired3
Europe ................... 882 449,952 0.2 882 449,952 0.2
Hong Kong ............ 232 89,581 0.3 232 89,581 0.3
Rest of Asia-Pacific 374 101,690 0.4 374 101,690 0.4
North America ....... 4,804 293,456 1.6 4,804 293,456 1.6
Latin America ........ 626 47,770 1.3 626 47,770 1.3
6,918 982,449 0.7 6,918 982,449 0.7
2,699 6,477 16,506 994,276 1.7 19,205 1,000,753 1.9
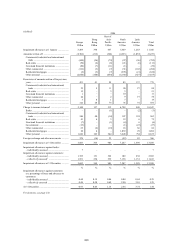
At 31 December 2006
Impaired loans and
advances2
Europe ................... 1,725 4,031 42.8 1,209 1,816 66.6 2,934 5,847 50.2
Hong Kong ............ 131 407 32.2 17 47 36.2 148 454 32.6
Rest of Asia-Pacific 362 649 55.8 228 535 42.6 590 1,184 49.8
North America ....... 109 421 25.9 3,716 4,401 84.4 3,825 4,822 79.3
Latin America ........ 238 325 73.2 787 1,153 68.3 1,025 1,478 69.4
2,565 5,833 44.0 5,957 7,952 74.9 8,522 13,785 61.8
Collectively assessed
loans and advances
not impaired3
Europe ................... 742 390,328 0.2 742 390,328 0.2
Hong Kong ............ 217 84,193 0.3 217 84,193 0.3
Rest of Asia-Pacific 311 77,291 0.4 311 77,291 0.4
North America ....... 3,422 280,412 1.2 3,422 280,412 1.2
Latin America ........ 364 35,702 1.0 364 35,702 1.0
5,056 867,926 0.6 5,056 867,926 0.6
2,565 5,833 11,013 875,878 1.3 13,578 881,711 1.5
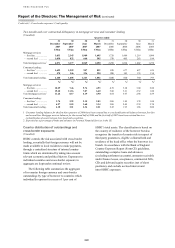
1 Collectively assessed loans and advances comprise homogeneous groups of loans that are not considered individually significant, and
loans subject to individual assessment where no impairment has been identified on an individual basis, but on which a collective
impairment allowance has been calculated to reflect losses which have been incurred but not yet identified.
2 Impaired loans and advances are grades 6 and 7 by reference to the Group’s legacy credit rating system.
3 Collectively assessed loans and advances not impaired are grades 1 to 5 by reference to the Group’s legacy credit rating system.
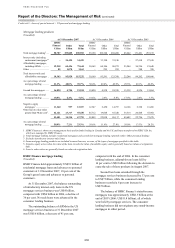
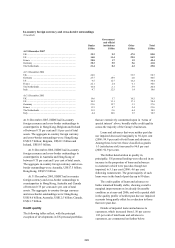
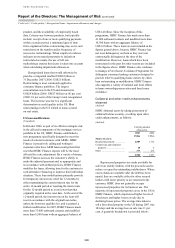
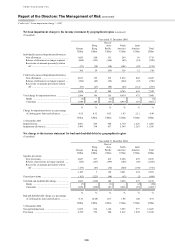
Year ended 31 December 2007 compared
with year ended 31 December 2006
(Unaudited)
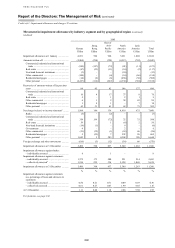
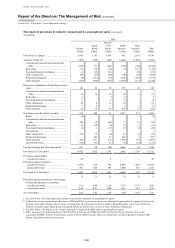
Total impaired loans to customers were
US$18.3 billion at 31 December 2007, an increase of
33 per cent since the end of 2006 (28 per cent at
constant currency). Impaired loans were 2 per cent
of gross customer loans and advances, broadly in
line with 31 December 2006.
The commentary that follows compares
balances at 31 December 2007 with those at
31 December 2006, at constant exchange rates.
In Europe, impaired loans at US$6.3 billion
were 2 per cent higher than at the end of 2006.
Higher impaired loans in France and Turkey were