HSBC 2007 Annual Report Download - page 81
Download and view the complete annual report
Please find page 81 of the 2007 HSBC annual report below. You can navigate through the pages in the report by either clicking on the pages listed below, or by using the keyword search tool below to find specific information within the annual report.-
 1
1 -
2
-
3
-
4
-
5
-
6
-
7
-
8
-
9
-
10
-
11
-
12
-
13
-
14
-
15
-
16
-
17
-
18
-
19
-
20
-
21
-
22
-
23
-
24
-
25
-
26
-
27
-
28
-
29
-
30
-
31
-
32
-
33
-
34
-
35
-
36
-
37
-
38
-
39
-
40
-
41
-
42
-
43
-
44
-
45
-
46
-
47
-
48
-
49
-
50
-
51
-
52
-
53
-
54
-
55
-
56
-
57
-
58
-
59
-
60
-
61
-
62
-
63
-
64
-
65
-
66
-
67
-
68
-
69
-
70
-
 71
71 -
 72
72 -
 73
73 -
 74
74 -
 75
75 -
 76
76 -
 77
77 -
 78
78 -
 79
79 -
 80
80 -
 81
81 -
 82
82 -
 83
83 -
 84
84 -
 85
85 -
 86
86 -
 87
87 -
 88
88 -
 89
89 -
 90
90 -
 91
91 -
92
-
93
-
94
-
95
-
96
-
97
-
98
-
99
-
100
-
101
-
102
-
103
-
104
-
105
-
106
-
107
-
108
-
109
-
110
-
111
-
112
-
113
-
114
-
115
-
116
-
117
-
118
-
119
-
120
-
121
-
122
-
123
-
124
-
125
-
126
-
127
-
128
-
129
-
130
-
131
-
132
-
133
-
134
-
135
-
136
-
137
-
138
-
139
-
140
-
141
-
142
-
143
-
144
-
145
-
146
-
147
-
148
-
149
-
150
-
151
-
152
-
153
-
154
-
155
-
156
-
157
-
158
-
159
-
160
-
161
-
162
-
163
-
164
-
165
-
166
-
167
-
168
-
169
-
170
-
171
-
172
-
173
-
174
-
175
-
176
-
177
-
178
-
179
-
180
-
181
-
182
-
183
-
184
-
185
-
186
-
187
-
188
-
189
-
190
-
191
-
192
-
193
-
194
-
195
-
196
-
197
-
198
-
199
-
200
-
201
-
202
-
203
-
204
-
205
-
206
-
207
-
208
-
209
-
210
-
211
-
212
-
213
-
214
-
215
-
216
-
217
-
218
-
219
-
220
-
221
-
222
-
223
-
224
-
225
-
226
-
227
-
228
-
229
-
230
-
231
-
232
-
233
-
234
-
235
-
236
-
237
-
238
-
239
-
240
-
241
-
242
-
243
-
244
-
245
-
246
-
247
-
248
-
249
-
250
-
251
-
252
-
253
-
254
-
255
-
256
-
257
-
258
-
259
-
260
-
261
-
262
-
263
-
264
-
265
-
266
-
267
-
268
-
269
-
270
-
271
-
272
-
273
-
274
-
275
-
276
-
277
-
278
-
279
-
280
-
281
-
282
-
283
-
284
-
285
-
286
-
287
-
288
-
289
-
290
-
291
-
292
-
293
-
294
-
295
-
296
-
297
-
298
-
299
-
300
-
301
-
302
-
303
-
304
-
305
-
306
-
307
-
308
-
309
-
310
-
311
-
312
-
313
-
314
-
315
-
316
-
317
-
318
-
319
-
320
-
321
-
322
-
323
-
324
-
325
-
326
-
327
-
328
-
329
-
330
-
331
-
332
-
333
-
334
-
335
-
336
-
337
-
338
-
339
-
340
-
341
-
342
-
343
-
344
-
345
-
346
-
347
-
348
-
349
-
350
-
351
-
352
-
353
-
354
-
355
-
356
-
357
-
358
-
359
-
360
-
361
-
362
-
363
-
364
-
365
-
366
-
367
-
368
-
369
-
370
-
371
-
372
-
373
-
374
-
375
-
376
-
377
-
378
-
379
-
380
-
381
-
382
-
383
-
384
-
385
-
386
-
387
-
388
-
389
-
390
-
391
-
392
-
393
-
394
-
395
-
396
-
397
-
398
-
399
-
400
-
401
-
402
-
403
-
404
-
405
-
406
-
407
-
408
-
409
-
410
-
411
-
412
-
413
-
414
-
415
-
416
-
417
-
418
-
419
-
420
-
421
-
422
-
423
-
424
-
425
-
426
-
427
-
428
-
429
-
430
-
431
-
432
-
433
-
434
-
435
-
436
-
437
-
438
-
439
-
440
-
441
-
442
-
443
-
444
-
445
-
446
-
447
-
448
-
449
-
450
-
451
-
452
-
453
-
454
-
455
-
456
-
457
-
458
-
459
-
460
-
461
-
462
-
463
-
464
-
465
-
466
-
467
-
468
-
469
-
470
-
471
-
472
-
473
-
474
-
475
-
476
 |
 |
79
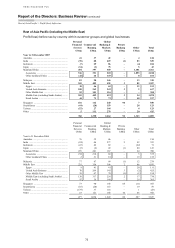
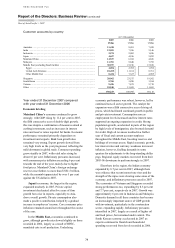
In the Middle East, operating profit grew by
29 per cent, underpinned by strong economic growth
and the success of new International Banking Centres
and dedicated Business Banking Centres. Small-
business banking was introduced in Bahrain, Qatar
and Jordan. In the UAE, additional relationship
managers in the business banking unit helped to drive
a 30 per cent increase in revenues. The region
performed well, particularly in deposits and trade-
related lending.
Operating profit grew by 56 per cent in mainland
China to US$46 million, reflecting growing lending
volumes to mid-market customers and improved
spreads on lending products. Lending volume growth
resulted in part from increased cross-border activity,
new branches and additional front-line employees.
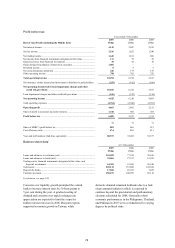
In Singapore, profit before tax rose by 19 per
cent, driven by higher net interest income from
balance sheet growth. Enhancements to the
receivables finance offering contributed to strong
growth in fee income.
In India, profit before tax grew by 76 per cent.
Growth was broadly based with both net interest
income and net fee income registering healthy
increases of 78 per cent and 57 per cent, respectively.
Net interest income rose from wider asset spreads
and balance sheet growth, driven by selective lending
related to the booming Indian real estate sector.
Higher foreign exchange volumes and treasury
product sales drove growth in fee income.
Revenues in Malaysia rose by 9 per cent, again
due to strong balance sheet growth, further supported
by initiatives to grow deposit balances and
complemented by improved liability margins.
Lending rose, particularly due to corporate term
lending, but competition resulted in narrower
spreads. Results in 2006 benefited from net
recoveries on loan impairment charges which
did not recur.
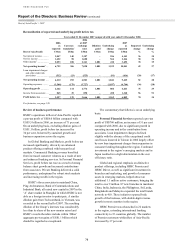
Cross-border activity was facilitated in part
through the cross-border referral system, Global
Links, which was extended across most of the region.
Regional alignments and the acceleration of cross-
border activity led to an 87 per cent increase in
successful referrals. A further 19 International
Banking Centres were opened in 2007, taking the
coverage to 26 of the region’s countries and
territories.
Net interest income grew by 29 per cent to
US$1.1 billion. The opening of new branches, an
increased commercial presence supported by call
centres, and the enhancement of BIB in Asia-Pacific
contributed to customer acquisition, particularly in
mainland China, Malaysia, Vietnam and Mauritius,
spurring deposit and loan growth.
The UAE drove a strong increase in net interest
income in the Middle East. Deposits and lending
each recorded substantial volume growth as the
region continued to experience high levels of
investment and business expansion which buoyed
local economic activity. Trade flows in the region
also benefited small and medium-sized businesses
and their related deposits. Trade-related lending rose
by 45 per cent.
In India, net interest income grew by 78 per cent,
largely due to trade-related lending products in
combination with growth in deposits. Both lending
and deposits benefited from an increase in the
number of frontline sales staff in provincial cities.
Net interest income from small and medium-sized
businesses rose by 49 per cent. Increased margins on
current accounts reflected the higher interest rates in
the region. Local incorporation in Mauritius allowed
closer alignment with HSBC in India.
In mainland China, net interest income rose by
79 per cent as the opening of new branches and
recruitment of additional frontline employees
succeeded in attracting new deposits and additional
sales of lending products. HSBC utilised country
desks to facilitate a greater number of cross-border
transactions with South Korea, Vietnam, Hong Kong
and Taiwan, which partly contributed to the 68 per
cent growth in commercial lending volumes. The
widening of liability spreads also contributed to net
interest income growth.
Net interest income also rose strongly in
Singapore and Malaysia, mainly due to higher
deposit balances. In Malaysia, improvements to
direct channels helped to generate increased balances
in current accounts, and spreads rose accordingly.
Growth in South Korea was partly the result of the
successful acquisition of new customers.
Net fee income increased by 26 per cent, largely
due to the continued growth of trade services,
particularly in the Middle East, and cross-border
transaction fees in India.
Trade-related lending fees rose by 24 per cent.
The majority of this increase arose in the Middle
East, where intra-regional trade flows increased as a
result of strong economic performance. In India,
customer acquisition of SME businesses, in
combination with higher volumes of transactions
from existing customers, increased trade-related
fees by 81 per cent. TradeSmart in Malaysia and
Tradeline in Bangladesh were among the initiatives
used to maintain HSBC’s reputation for providing