HSBC 2007 Annual Report Download - page 274
Download and view the complete annual report
Please find page 274 of the 2007 HSBC annual report below. You can navigate through the pages in the report by either clicking on the pages listed below, or by using the keyword search tool below to find specific information within the annual report.-
 1
1 -
2
-
3
-
4
-
5
-
6
-
7
-
8
-
9
-
10
-
11
-
12
-
13
-
14
-
15
-
16
-
17
-
18
-
19
-
20
-
21
-
22
-
23
-
24
-
25
-
26
-
27
-
28
-
29
-
30
-
31
-
32
-
33
-
34
-
35
-
36
-
37
-
38
-
39
-
40
-
41
-
42
-
43
-
44
-
45
-
46
-
47
-
48
-
49
-
50
-
51
-
52
-
53
-
54
-
55
-
56
-
57
-
58
-
59
-
60
-
61
-
62
-
63
-
64
-
65
-
66
-
67
-
68
-
69
-
70
-
71
-
72
-
73
-
74
-
75
-
76
-
77
-
78
-
79
-
80
-
81
-
82
-
83
-
84
-
85
-
86
-
87
-
88
-
89
-
90
-
91
-
92
-
93
-
94
-
95
-
96
-
97
-
98
-
99
-
100
-
101
-
102
-
103
-
104
-
105
-
106
-
107
-
108
-
109
-
110
-
111
-
112
-
113
-
114
-
115
-
116
-
117
-
118
-
119
-
120
-
121
-
122
-
123
-
124
-
125
-
126
-
127
-
128
-
129
-
130
-
131
-
132
-
133
-
134
-
135
-
136
-
137
-
138
-
139
-
140
-
141
-
142
-
143
-
144
-
145
-
146
-
147
-
148
-
149
-
150
-
151
-
152
-
153
-
154
-
155
-
156
-
157
-
158
-
159
-
160
-
161
-
162
-
163
-
164
-
165
-
166
-
167
-
168
-
169
-
170
-
171
-
172
-
173
-
174
-
175
-
176
-
177
-
178
-
179
-
180
-
181
-
182
-
183
-
184
-
185
-
186
-
187
-
188
-
189
-
190
-
191
-
192
-
193
-
194
-
195
-
196
-
197
-
198
-
199
-
200
-
201
-
202
-
203
-
204
-
205
-
206
-
207
-
208
-
209
-
210
-
211
-
212
-
213
-
214
-
215
-
216
-
217
-
218
-
219
-
220
-
221
-
222
-
223
-
224
-
225
-
226
-
227
-
228
-
229
-
230
-
231
-
232
-
233
-
234
-
235
-
236
-
237
-
238
-
239
-
240
-
241
-
242
-
243
-
244
-
245
-
246
-
247
-
248
-
249
-
250
-
251
-
252
-
253
-
254
-
255
-
256
-
257
-
258
-
259
-
260
-
261
-
262
-
263
-
 264
264 -
 265
265 -
 266
266 -
 267
267 -
 268
268 -
 269
269 -
 270
270 -
 271
271 -
 272
272 -
 273
273 -
 274
274 -
 275
275 -
 276
276 -
 277
277 -
 278
278 -
 279
279 -
 280
280 -
 281
281 -
 282
282 -
 283
283 -
 284
284 -
285
-
286
-
287
-
288
-
289
-
290
-
291
-
292
-
293
-
294
-
295
-
296
-
297
-
298
-
299
-
300
-
301
-
302
-
303
-
304
-
305
-
306
-
307
-
308
-
309
-
310
-
311
-
312
-
313
-
314
-
315
-
316
-
317
-
318
-
319
-
320
-
321
-
322
-
323
-
324
-
325
-
326
-
327
-
328
-
329
-
330
-
331
-
332
-
333
-
334
-
335
-
336
-
337
-
338
-
339
-
340
-
341
-
342
-
343
-
344
-
345
-
346
-
347
-
348
-
349
-
350
-
351
-
352
-
353
-
354
-
355
-
356
-
357
-
358
-
359
-
360
-
361
-
362
-
363
-
364
-
365
-
366
-
367
-
368
-
369
-
370
-
371
-
372
-
373
-
374
-
375
-
376
-
377
-
378
-
379
-
380
-
381
-
382
-
383
-
384
-
385
-
386
-
387
-
388
-
389
-
390
-
391
-
392
-
393
-
394
-
395
-
396
-
397
-
398
-
399
-
400
-
401
-
402
-
403
-
404
-
405
-
406
-
407
-
408
-
409
-
410
-
411
-
412
-
413
-
414
-
415
-
416
-
417
-
418
-
419
-
420
-
421
-
422
-
423
-
424
-
425
-
426
-
427
-
428
-
429
-
430
-
431
-
432
-
433
-
434
-
435
-
436
-
437
-
438
-
439
-
440
-
441
-
442
-
443
-
444
-
445
-
446
-
447
-
448
-
449
-
450
-
451
-
452
-
453
-
454
-
455
-
456
-
457
-
458
-
459
-
460
-
461
-
462
-
463
-
464
-
465
-
466
-
467
-
468
-
469
-
470
-
471
-
472
-
473
-
474
-
475
-
476
 |
 |

HSBC HOLDINGS PLC
Report of the Directors: The Management of Risk (continued)
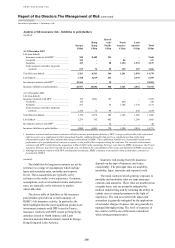
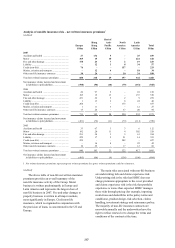
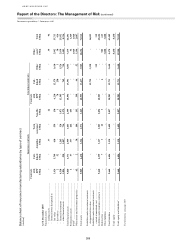
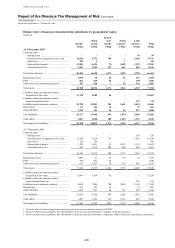
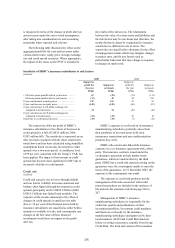
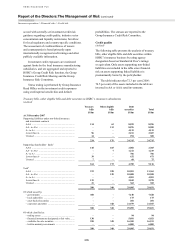
Insurance operations > Financial risks > Market risk
272
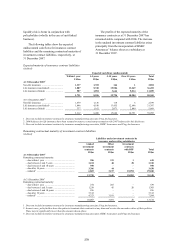
At 31 December 2006
Life linked Life non-linked Non-life Other
contracts1 contracts2 insurance3 assets4 Total6
US$m US$m US$m US$m US$m
Trading assets
Debt securities ...................................... – – 117 39 156
Financial assets designated at fair value
Treasury bills ........................................ 54 24 55 – 133
Debt securities ...................................... 4,304 2,492 32 934 7,762
Equity securities ................................... 8,681 1,815 7 40 10,543
13,039 4,331 94 974 18,438
Financial investments
Held-to-maturity:
Treasury bills ........................................ – – 44 – 44
Debt securities ...................................... – 5,585 279 333 6,197
– 5,585 323 333 6,241
Available-for-sale:
Treasury bills ........................................ – 14 102 141 257
Other eligible bills ................................ – – 355 145 500
Debt securities ...................................... – 1,284 738 1,415 3,437
Equity securities ................................... – 13 36 139 188
– 1,311 1,231 1,840 4,382
Derivatives................................................. 780 99 – – 879
Other financial assets7 .............................. 274 2,079 712 632 3,697
14,093 13,405 2,477 3,818 33,793
1 Comprises life linked insurance contracts and linked long-term investment contracts.
2 Comprises life non-linked insurance contracts and non-linked long-term investment contracts.
3 Comprises non-life insurance contracts.
4 Comprises shareholder assets.
5 Does not include financial assets of insurance manufacturing associate, Ping An Insurance.
6 Does not include financial assets of insurance manufacturing associates, HSBC Assurances and Ping An Insurance.
7 Comprises mainly loans and advances to banks, cash and intercompany balances with other non-insurance legal entities.
The table demonstrates that for linked contracts,
HSBC typically designates assets at fair value. For
non-linked contracts, the classification of the assets
is driven by the nature of the underlying contract.
The table also shows that approximately
55.4 per cent of financial assets was invested in debt
securities at 31 December 2007 (2006: 51.9 per cent)
with 30.3 per cent (2006: 31.8 per cent) invested in
equity securities.
In life linked insurance, premium income less
charges levied is invested in a portfolio of assets.
HSBC manages the financial risk of this product on
behalf of the policyholders by holding appropriate
assets in segregated funds or portfolios to which the
liabilities are linked. HSBC typically retains some
exposure to market risk as the market value of the
linked assets influences the fees charged by HSBC
and thereby affects the recoverability of expenses
incurred by the Group in managing the product. The
assets held to support life linked liabilities
represented 29.7 per cent of the total financial assets
of HSBC’s insurance manufacturing subsidiaries at
the end of 2007 (2006: 41.7 per cent).
Market risk
(Audited)
Insurance and investment products manufactured by
HSBC’s insurance manufacturing subsidiaries
typically comprise features or combinations of
features which may not be easily or exactly
replicated by investments. Market risk arises from
the mismatch between product liabilities and the
investment assets which back them. For example,
interest rate risk arises from the mismatch between
asset and liability yields and maturities.
Description of market risks
(Audited)
The main features of products manufactured by
HSBC’s insurance manufacturing subsidiaries which
generate market risks, and the market risks to which
these features expose the subsidiaries, are discussed
in the sections which follow.
Long-term insurance or investment products
may incorporate investment return guarantees,
divided into the following categories: