HSBC 2007 Annual Report Download - page 154
Download and view the complete annual report
Please find page 154 of the 2007 HSBC annual report below. You can navigate through the pages in the report by either clicking on the pages listed below, or by using the keyword search tool below to find specific information within the annual report.-
 1
1 -
2
-
3
-
4
-
5
-
6
-
7
-
8
-
9
-
10
-
11
-
12
-
13
-
14
-
15
-
16
-
17
-
18
-
19
-
20
-
21
-
22
-
23
-
24
-
25
-
26
-
27
-
28
-
29
-
30
-
31
-
32
-
33
-
34
-
35
-
36
-
37
-
38
-
39
-
40
-
41
-
42
-
43
-
44
-
45
-
46
-
47
-
48
-
49
-
50
-
51
-
52
-
53
-
54
-
55
-
56
-
57
-
58
-
59
-
60
-
61
-
62
-
63
-
64
-
65
-
66
-
67
-
68
-
69
-
70
-
71
-
72
-
73
-
74
-
75
-
76
-
77
-
78
-
79
-
80
-
81
-
82
-
83
-
84
-
85
-
86
-
87
-
88
-
89
-
90
-
91
-
92
-
93
-
94
-
95
-
96
-
97
-
98
-
99
-
100
-
101
-
102
-
103
-
104
-
105
-
106
-
107
-
108
-
109
-
110
-
111
-
112
-
113
-
114
-
115
-
116
-
117
-
118
-
119
-
120
-
121
-
122
-
123
-
124
-
125
-
126
-
127
-
128
-
129
-
130
-
131
-
132
-
133
-
134
-
135
-
136
-
137
-
138
-
139
-
140
-
141
-
142
-
143
-
 144
144 -
 145
145 -
 146
146 -
 147
147 -
 148
148 -
 149
149 -
 150
150 -
 151
151 -
 152
152 -
 153
153 -
 154
154 -
 155
155 -
 156
156 -
 157
157 -
 158
158 -
 159
159 -
 160
160 -
 161
161 -
 162
162 -
 163
163 -
 164
164 -
165
-
166
-
167
-
168
-
169
-
170
-
171
-
172
-
173
-
174
-
175
-
176
-
177
-
178
-
179
-
180
-
181
-
182
-
183
-
184
-
185
-
186
-
187
-
188
-
189
-
190
-
191
-
192
-
193
-
194
-
195
-
196
-
197
-
198
-
199
-
200
-
201
-
202
-
203
-
204
-
205
-
206
-
207
-
208
-
209
-
210
-
211
-
212
-
213
-
214
-
215
-
216
-
217
-
218
-
219
-
220
-
221
-
222
-
223
-
224
-
225
-
226
-
227
-
228
-
229
-
230
-
231
-
232
-
233
-
234
-
235
-
236
-
237
-
238
-
239
-
240
-
241
-
242
-
243
-
244
-
245
-
246
-
247
-
248
-
249
-
250
-
251
-
252
-
253
-
254
-
255
-
256
-
257
-
258
-
259
-
260
-
261
-
262
-
263
-
264
-
265
-
266
-
267
-
268
-
269
-
270
-
271
-
272
-
273
-
274
-
275
-
276
-
277
-
278
-
279
-
280
-
281
-
282
-
283
-
284
-
285
-
286
-
287
-
288
-
289
-
290
-
291
-
292
-
293
-
294
-
295
-
296
-
297
-
298
-
299
-
300
-
301
-
302
-
303
-
304
-
305
-
306
-
307
-
308
-
309
-
310
-
311
-
312
-
313
-
314
-
315
-
316
-
317
-
318
-
319
-
320
-
321
-
322
-
323
-
324
-
325
-
326
-
327
-
328
-
329
-
330
-
331
-
332
-
333
-
334
-
335
-
336
-
337
-
338
-
339
-
340
-
341
-
342
-
343
-
344
-
345
-
346
-
347
-
348
-
349
-
350
-
351
-
352
-
353
-
354
-
355
-
356
-
357
-
358
-
359
-
360
-
361
-
362
-
363
-
364
-
365
-
366
-
367
-
368
-
369
-
370
-
371
-
372
-
373
-
374
-
375
-
376
-
377
-
378
-
379
-
380
-
381
-
382
-
383
-
384
-
385
-
386
-
387
-
388
-
389
-
390
-
391
-
392
-
393
-
394
-
395
-
396
-
397
-
398
-
399
-
400
-
401
-
402
-
403
-
404
-
405
-
406
-
407
-
408
-
409
-
410
-
411
-
412
-
413
-
414
-
415
-
416
-
417
-
418
-
419
-
420
-
421
-
422
-
423
-
424
-
425
-
426
-
427
-
428
-
429
-
430
-
431
-
432
-
433
-
434
-
435
-
436
-
437
-
438
-
439
-
440
-
441
-
442
-
443
-
444
-
445
-
446
-
447
-
448
-
449
-
450
-
451
-
452
-
453
-
454
-
455
-
456
-
457
-
458
-
459
-
460
-
461
-
462
-
463
-
464
-
465
-
466
-
467
-
468
-
469
-
470
-
471
-
472
-
473
-
474
-
475
-
476
 |
 |

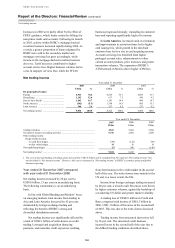
HSBC HOLDINGS PLC
Report of the Directors: Financial Review (continued)
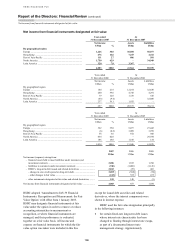
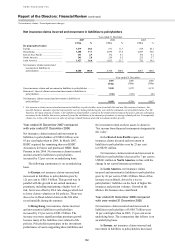
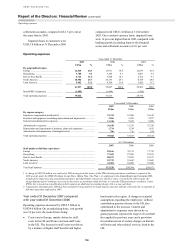
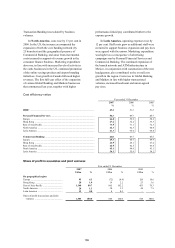
Net insurance claims / Loan impairment charges
152
Net insurance claims incurred and movement in liabilities to policyholders
Year ended 31 December
2007 2006 2005
US$m % US$m % US$m %
By geographical region
Europe ...................................................... 3,479 40.4 531 11.3 818 20.1
Hong Kong .............................................. 3,208 37.3 2,699 57.4 2,059 50.6
Rest of Asia-Pacific ................................. 253 2.9 192 4.1 166 4.1
North America ......................................... 241 2.8 259 5.5 232 5.7
Latin America .......................................... 1,427 16.6 1,023 21.7 792 19.5
Net insurance claims incurred and
movement in liabilities to
policyholders ....................................... 8,608
100.0 4,704
100.0 4,067
100.0
Year ended 31 December
2007
US$m
2006
US$m
2005
US$m
Gross insurance claims and movement in liabilities to policyholders ............ 9,550 5,072 4,153
Reinsurers’ share of claims incurred and movement in liabilities to
policyholders ............................................................................................... (942) (368) (86)
Net insurance claims incurred and movement in liabilities to
policyholders1 .............................................................................................. 8,608
4,704 4,067
1 Net insurance claims incurred and movement in liabilities to policyholders arise from both life and non-life insurance business. For
non-life business, amounts reported represent the cost of claims paid during the year and the estimated cost of notified claims. For life
business, the main element of claims is the liability to policyholders created on the initial underwriting of the policy and any subsequent
movement in the liability that arises, primarily from the attribution of investment performance to savings-related policies. Consequently,
claims rise in line with increases in sales of savings-related business and with investment market growth.
Year ended 31 December 2007 compared
with year ended 31 December 2006
Net insurance claims incurred and movement in
liabilities to policyholders of US$8.6 billion were
83 per cent higher than in 2006. In March 2007,
HSBC acquired the remaining shares in HSBC
Assurances in France and purchased HSBC Bank
Panama in late 2006. Net insurance claims incurred
and movement in liabilities to policyholders
increased by 32 per cent on an underlying basis.
The following commentary is on an underlying
basis.
In Europe, net insurance claims incurred and
movement in liabilities to policyholders grew by
121 per cent to US$3.5 billion. This growth was in
parallel with the growth in net earned insurance
premiums, including maintaining a higher level of
risk, but it was offset by FSA rule changes which led
to lower claims valuation on life policies. There was
also a rise in flood-related claims in the UK after
record rainfalls during the summer.
In Hong Kong, net insurance claims incurred
and movement in liabilities to policyholders
increased by 19 per cent to US$3.2 billion. The
increase was more significant than premium growth
because many of the liabilities were related to life
policies. Policyholders participate in the investment
performance of assets supporting these liabilities and
the investment return on these assets is shown in
‘Net income from financial instruments designated at
fair value’.
In the Rest of Asia-Pacific region, net
insurance claims incurred and movement in
liabilities to policyholders rose by 25 per cent
to US$253 million.
Net insurance claims incurred and movement in
liabilities to policyholders decreased by 7 per cent to
US$241 million in North America, in line with the
change in net earned insurance premiums.
In Latin America, net insurance claims
incurred and movement in liabilities to policyholders
grew by 26 per cent to US$1.4 billion. Most of this
increase was in Brazil, driven by a rise in
policyholders’ liabilities on the back of higher life
insurance and pension volumes. Growth in the
Mexico life business also contributed.
Year ended 31 December 2006 compared
with year ended 31 December 2005
Net insurance claims incurred and movement in
liabilities to policyholders of US$4.7 billion were
16 per cent higher than in 2005, 15 per cent on an
underlying basis. The commentary that follows is on
an underlying basis.
In Europe, net insurance claims incurred and
movement in liabilities to policyholders decreased