HSBC 2007 Annual Report Download - page 399
Download and view the complete annual report
Please find page 399 of the 2007 HSBC annual report below. You can navigate through the pages in the report by either clicking on the pages listed below, or by using the keyword search tool below to find specific information within the annual report.-
 1
1 -
2
-
3
-
4
-
5
-
6
-
7
-
8
-
9
-
10
-
11
-
12
-
13
-
14
-
15
-
16
-
17
-
18
-
19
-
20
-
21
-
22
-
23
-
24
-
25
-
26
-
27
-
28
-
29
-
30
-
31
-
32
-
33
-
34
-
35
-
36
-
37
-
38
-
39
-
40
-
41
-
42
-
43
-
44
-
45
-
46
-
47
-
48
-
49
-
50
-
51
-
52
-
53
-
54
-
55
-
56
-
57
-
58
-
59
-
60
-
61
-
62
-
63
-
64
-
65
-
66
-
67
-
68
-
69
-
70
-
71
-
72
-
73
-
74
-
75
-
76
-
77
-
78
-
79
-
80
-
81
-
82
-
83
-
84
-
85
-
86
-
87
-
88
-
89
-
90
-
91
-
92
-
93
-
94
-
95
-
96
-
97
-
98
-
99
-
100
-
101
-
102
-
103
-
104
-
105
-
106
-
107
-
108
-
109
-
110
-
111
-
112
-
113
-
114
-
115
-
116
-
117
-
118
-
119
-
120
-
121
-
122
-
123
-
124
-
125
-
126
-
127
-
128
-
129
-
130
-
131
-
132
-
133
-
134
-
135
-
136
-
137
-
138
-
139
-
140
-
141
-
142
-
143
-
144
-
145
-
146
-
147
-
148
-
149
-
150
-
151
-
152
-
153
-
154
-
155
-
156
-
157
-
158
-
159
-
160
-
161
-
162
-
163
-
164
-
165
-
166
-
167
-
168
-
169
-
170
-
171
-
172
-
173
-
174
-
175
-
176
-
177
-
178
-
179
-
180
-
181
-
182
-
183
-
184
-
185
-
186
-
187
-
188
-
189
-
190
-
191
-
192
-
193
-
194
-
195
-
196
-
197
-
198
-
199
-
200
-
201
-
202
-
203
-
204
-
205
-
206
-
207
-
208
-
209
-
210
-
211
-
212
-
213
-
214
-
215
-
216
-
217
-
218
-
219
-
220
-
221
-
222
-
223
-
224
-
225
-
226
-
227
-
228
-
229
-
230
-
231
-
232
-
233
-
234
-
235
-
236
-
237
-
238
-
239
-
240
-
241
-
242
-
243
-
244
-
245
-
246
-
247
-
248
-
249
-
250
-
251
-
252
-
253
-
254
-
255
-
256
-
257
-
258
-
259
-
260
-
261
-
262
-
263
-
264
-
265
-
266
-
267
-
268
-
269
-
270
-
271
-
272
-
273
-
274
-
275
-
276
-
277
-
278
-
279
-
280
-
281
-
282
-
283
-
284
-
285
-
286
-
287
-
288
-
289
-
290
-
291
-
292
-
293
-
294
-
295
-
296
-
297
-
298
-
299
-
300
-
301
-
302
-
303
-
304
-
305
-
306
-
307
-
308
-
309
-
310
-
311
-
312
-
313
-
314
-
315
-
316
-
317
-
318
-
319
-
320
-
321
-
322
-
323
-
324
-
325
-
326
-
327
-
328
-
329
-
330
-
331
-
332
-
333
-
334
-
335
-
336
-
337
-
338
-
339
-
340
-
341
-
342
-
343
-
344
-
345
-
346
-
347
-
348
-
349
-
350
-
351
-
352
-
353
-
354
-
355
-
356
-
357
-
358
-
359
-
360
-
361
-
362
-
363
-
364
-
365
-
366
-
367
-
368
-
369
-
370
-
371
-
372
-
373
-
374
-
375
-
376
-
377
-
378
-
379
-
380
-
381
-
382
-
383
-
384
-
385
-
386
-
387
-
388
-
 389
389 -
 390
390 -
 391
391 -
 392
392 -
 393
393 -
 394
394 -
 395
395 -
 396
396 -
 397
397 -
 398
398 -
 399
399 -
 400
400 -
 401
401 -
 402
402 -
 403
403 -
 404
404 -
 405
405 -
 406
406 -
 407
407 -
 408
408 -
 409
409 -
410
-
411
-
412
-
413
-
414
-
415
-
416
-
417
-
418
-
419
-
420
-
421
-
422
-
423
-
424
-
425
-
426
-
427
-
428
-
429
-
430
-
431
-
432
-
433
-
434
-
435
-
436
-
437
-
438
-
439
-
440
-
441
-
442
-
443
-
444
-
445
-
446
-
447
-
448
-
449
-
450
-
451
-
452
-
453
-
454
-
455
-
456
-
457
-
458
-
459
-
460
-
461
-
462
-
463
-
464
-
465
-
466
-
467
-
468
-
469
-
470
-
471
-
472
-
473
-
474
-
475
-
476
 |
 |

397
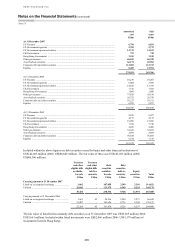
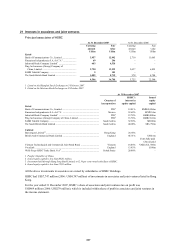
16 Trading assets
2007 2006
US$m US$m
Trading assets:
– not subject to repledge or resale by counterparties ........................................................................ 308,286 273,507
– which may be repledged or resold by counterparties ..................................................................... 137,682 54,640
445,968 328,147
Treasury and other eligible bills ........................................................................................................ 16,439 21,759
Debt securities ................................................................................................................................... 178,834 155,447
Equity securities ................................................................................................................................. 51,476 27,149
246,749 204,355
Loans and advances to banks ............................................................................................................ 100,440 52,006
Loans and advances to customers ...................................................................................................... 98,779 71,786
445,968 328,147
The following table provides an analysis of trading securities which are valued at fair value:
Fair value
2007 2006
US$m US$m
US Treasury and US Government agencies ...................................................................................... 17,335 8,348
UK Government ................................................................................................................................. 11,607 6,176
Hong Kong Government ................................................................................................................... 5,517 8,759
Other government .............................................................................................................................. 80,268 70,747
Asset-backed securities ...................................................................................................................... 20,479 15,781
Corporate debt and other securities ................................................................................................... 60,067 67,395
Equity securities ................................................................................................................................. 51,476 27,149
246,749 204,355
Included within the above figures are debt securities issued by banks and other financial institutions of US$69,818 million (2006:
US$36,153 million).
The following table analyses trading securities between those listed on a recognised exchange and those that are
unlisted:
Treasury
and other
eligible bills
Debt
securities
Equity
securities
Total
US$m US$m US$m US$m
Fair value at 31 December 2007
Listed on a recognised exchange1 ................................. 34 115,593 50,092 165,719
Unlisted ......................................................................... 16,405 63,241 1,384 81,030
16,439 178,834 51,476 246,749
Fair value at 31 December 2006
Listed on a recognised exchange1 ................................. 1,373 112,403 25,337 139,113
Unlisted ......................................................................... 20,386 43,044 1,812 65,242
21,759 155,447 27,149 204,355
1 Included within listed investments are US$6,977 million (2006: US$4,309 million) of investments listed in Hong Kong.
Loans and advances to banks held for trading consist of:
2007 2006
US$m US$m
Reverse repos ..................................................................................................................................... 80,476 41,475
Settlement accounts ........................................................................................................................... 8,227 4,655
Stock borrowing ................................................................................................................................. 8,259 4,727
Other .................................................................................................................................................. 3,478 1,149
100,440 52,006