HSBC 2007 Annual Report Download - page 101
Download and view the complete annual report
Please find page 101 of the 2007 HSBC annual report below. You can navigate through the pages in the report by either clicking on the pages listed below, or by using the keyword search tool below to find specific information within the annual report.-
 1
1 -
2
-
3
-
4
-
5
-
6
-
7
-
8
-
9
-
10
-
11
-
12
-
13
-
14
-
15
-
16
-
17
-
18
-
19
-
20
-
21
-
22
-
23
-
24
-
25
-
26
-
27
-
28
-
29
-
30
-
31
-
32
-
33
-
34
-
35
-
36
-
37
-
38
-
39
-
40
-
41
-
42
-
43
-
44
-
45
-
46
-
47
-
48
-
49
-
50
-
51
-
52
-
53
-
54
-
55
-
56
-
57
-
58
-
59
-
60
-
61
-
62
-
63
-
64
-
65
-
66
-
67
-
68
-
69
-
70
-
71
-
72
-
73
-
74
-
75
-
76
-
77
-
78
-
79
-
80
-
81
-
82
-
83
-
84
-
85
-
86
-
87
-
88
-
89
-
90
-
 91
91 -
 92
92 -
 93
93 -
 94
94 -
 95
95 -
 96
96 -
 97
97 -
 98
98 -
 99
99 -
 100
100 -
 101
101 -
 102
102 -
 103
103 -
 104
104 -
 105
105 -
 106
106 -
 107
107 -
 108
108 -
 109
109 -
 110
110 -
 111
111 -
112
-
113
-
114
-
115
-
116
-
117
-
118
-
119
-
120
-
121
-
122
-
123
-
124
-
125
-
126
-
127
-
128
-
129
-
130
-
131
-
132
-
133
-
134
-
135
-
136
-
137
-
138
-
139
-
140
-
141
-
142
-
143
-
144
-
145
-
146
-
147
-
148
-
149
-
150
-
151
-
152
-
153
-
154
-
155
-
156
-
157
-
158
-
159
-
160
-
161
-
162
-
163
-
164
-
165
-
166
-
167
-
168
-
169
-
170
-
171
-
172
-
173
-
174
-
175
-
176
-
177
-
178
-
179
-
180
-
181
-
182
-
183
-
184
-
185
-
186
-
187
-
188
-
189
-
190
-
191
-
192
-
193
-
194
-
195
-
196
-
197
-
198
-
199
-
200
-
201
-
202
-
203
-
204
-
205
-
206
-
207
-
208
-
209
-
210
-
211
-
212
-
213
-
214
-
215
-
216
-
217
-
218
-
219
-
220
-
221
-
222
-
223
-
224
-
225
-
226
-
227
-
228
-
229
-
230
-
231
-
232
-
233
-
234
-
235
-
236
-
237
-
238
-
239
-
240
-
241
-
242
-
243
-
244
-
245
-
246
-
247
-
248
-
249
-
250
-
251
-
252
-
253
-
254
-
255
-
256
-
257
-
258
-
259
-
260
-
261
-
262
-
263
-
264
-
265
-
266
-
267
-
268
-
269
-
270
-
271
-
272
-
273
-
274
-
275
-
276
-
277
-
278
-
279
-
280
-
281
-
282
-
283
-
284
-
285
-
286
-
287
-
288
-
289
-
290
-
291
-
292
-
293
-
294
-
295
-
296
-
297
-
298
-
299
-
300
-
301
-
302
-
303
-
304
-
305
-
306
-
307
-
308
-
309
-
310
-
311
-
312
-
313
-
314
-
315
-
316
-
317
-
318
-
319
-
320
-
321
-
322
-
323
-
324
-
325
-
326
-
327
-
328
-
329
-
330
-
331
-
332
-
333
-
334
-
335
-
336
-
337
-
338
-
339
-
340
-
341
-
342
-
343
-
344
-
345
-
346
-
347
-
348
-
349
-
350
-
351
-
352
-
353
-
354
-
355
-
356
-
357
-
358
-
359
-
360
-
361
-
362
-
363
-
364
-
365
-
366
-
367
-
368
-
369
-
370
-
371
-
372
-
373
-
374
-
375
-
376
-
377
-
378
-
379
-
380
-
381
-
382
-
383
-
384
-
385
-
386
-
387
-
388
-
389
-
390
-
391
-
392
-
393
-
394
-
395
-
396
-
397
-
398
-
399
-
400
-
401
-
402
-
403
-
404
-
405
-
406
-
407
-
408
-
409
-
410
-
411
-
412
-
413
-
414
-
415
-
416
-
417
-
418
-
419
-
420
-
421
-
422
-
423
-
424
-
425
-
426
-
427
-
428
-
429
-
430
-
431
-
432
-
433
-
434
-
435
-
436
-
437
-
438
-
439
-
440
-
441
-
442
-
443
-
444
-
445
-
446
-
447
-
448
-
449
-
450
-
451
-
452
-
453
-
454
-
455
-
456
-
457
-
458
-
459
-
460
-
461
-
462
-
463
-
464
-
465
-
466
-
467
-
468
-
469
-
470
-
471
-
472
-
473
-
474
-
475
-
476
 |
 |
99
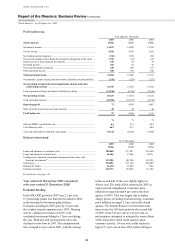
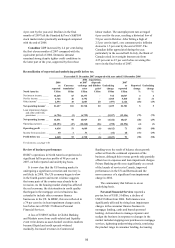
Banking in Canada. The cost efficiency ratio
reflected this, remaining broadly flat at 69.3 per cent.
Net interest income increased by 14 per cent
to US$273 million, excluding a US$42 million
geographical reclassification. This was driven by
new business in Canada and an increase in deposit
volumes in Bermuda. Net interest income in the US
remained broadly flat as a result of competitive
pressures.
Growth in net fee income of 16 per cent to
US$279 million was driven by higher investment in
discretionary funds especially the multi-manager
products offered in the US. WTAS also contributed
to the rise; this business was subsequently sold on
31 December 2007 in order to enable Private
Banking to focus on core activities. The sale resulted
in an US$18 million gain in other operating income.
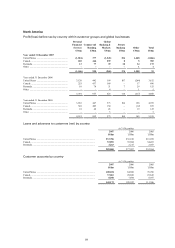
Client assets of US$58 billion, an increase
of 35 per cent, reflected expansion into Canada, a
market-driven rise in assets and net new money of
US$933 million.
Loan impairment charges decreased by 71 per
cent to US$10 million, reflecting the non-recurrence
of a large single loan impairment charge in 2006.
Operating expenses rose by 17 per cent to
US$415 million, with a rise in staff costs in both
support and front-office positions and the launch
of operations in Canada.
Within Other, profit before tax increased to
US$1.5 billion, driven largely by significant
fair value movements on HSBC’s own debt as a
result of the widening of credit spreads and related
derivatives in the second half of the year.
HSBC Technology USA Inc. and hsbc.com
provide technology services across North America,
the costs of which are recharged to specific entities.
Increased activity during the period contributed to a
14 per cent rise in operating expenses which were
recovered through ‘Other operating income’.
Year ended 31 December 2006 compared
with year ended 31 December 2005
Economic briefing
In the US, GDP growth in 2006 was 2.9 per cent.
Growth in the second half of the year moderated to
below 3 per cent, after average annualised growth of
4.1 per cent in the first half of the year. Consumer
spending in 2006 grew by 3.4 per cent, with average
annualised growth of 3.6 per cent in the second half
of the year. Housing activity weakened substantially
in 2006, with annualised declines in residential
investment of 11 per cent in the second quarter
followed by annualised declines of 19 per cent in the
third and fourth quarters of the year. There was some
optimism that housing starts may have begun to
stabilise by the year-end, with housing permits rising
in December after ten successive monthly falls.
Continued strong profits growth meant that business
investment remained robust but industrial production
weakened markedly towards the end of the year. The
unemployment rate remained relatively low,
averaging 4.6 per cent in 2006. The trade deficit
stabilised through most of the year and narrowed in
the final months of 2006 in response to strong global
growth and a weaker US dollar. Inflation rose by
4.3 per cent in the first half of the year due to energy
price rises but subsequently fell to an annual rate of
about 2 per cent as energy prices declined. The
Federal Reserve raised short-term interest rates by
1 per cent in the first half of 2006 to 5.25 per cent,
but kept rates unchanged thereafter. After rising
from 4.4 per cent to 5.2 per cent in the first half of
2006, 10-year note yields fell to a low of 4.4 per cent
in early December before increasing to 4.7 per cent
by the year-end. The S&P500 stock market index
rose by 13.6 per cent in the year.
The Canadian economy slowed during 2006,
with GDP growth falling from an annualised rate of
3.6 per cent at the beginning of the year to 1.7 per
cent by the third quarter, largely reflecting slower
export growth. Domestic demand remained robust
and HSBC expects the momentum seen in 2006 to
continue through 2007, supported by historically low
levels of unemployment and a housing market
which, although showing signs of moderation,
remained strong throughout 2006. Although energy
prices eased, 2006’s commodity boom was expected
to continue benefiting the Canadian economy
through 2007. Inflation remained problematic with
core prices moving above the Bank of Canada’s
preferred target rate of 2 per cent, and productivity
remained relatively weak. Having raised its
overnight interest rate from 3.25 per cent at the
start of 2006 to 4.25 per cent in May, the Bank of
Canada kept rates on hold for the rest of the year.
Review of business performance
HSBC’s operations in North America reported a
pre-tax profit of US$4.7 billion compared with
US$5.9 billion in 2005, a decrease of 21 per cent. On
an underlying basis, pre-tax profits declined by 25
per cent. Underlying net operating income before
loan impairment charges was higher by 6 per cent,
reflecting the income benefit of asset growth in
Personal Financial Services. This revenue growth
was more than offset by a significant rise in loan
impairment charges in the correspondent mortgage