HSBC 2007 Annual Report Download - page 105
Download and view the complete annual report
Please find page 105 of the 2007 HSBC annual report below. You can navigate through the pages in the report by either clicking on the pages listed below, or by using the keyword search tool below to find specific information within the annual report.-
 1
1 -
2
-
3
-
4
-
5
-
6
-
7
-
8
-
9
-
10
-
11
-
12
-
13
-
14
-
15
-
16
-
17
-
18
-
19
-
20
-
21
-
22
-
23
-
24
-
25
-
26
-
27
-
28
-
29
-
30
-
31
-
32
-
33
-
34
-
35
-
36
-
37
-
38
-
39
-
40
-
41
-
42
-
43
-
44
-
45
-
46
-
47
-
48
-
49
-
50
-
51
-
52
-
53
-
54
-
55
-
56
-
57
-
58
-
59
-
60
-
61
-
62
-
63
-
64
-
65
-
66
-
67
-
68
-
69
-
70
-
71
-
72
-
73
-
74
-
75
-
76
-
77
-
78
-
79
-
80
-
81
-
82
-
83
-
84
-
85
-
86
-
87
-
88
-
89
-
90
-
91
-
92
-
93
-
94
-
 95
95 -
 96
96 -
 97
97 -
 98
98 -
 99
99 -
 100
100 -
 101
101 -
 102
102 -
 103
103 -
 104
104 -
 105
105 -
 106
106 -
 107
107 -
 108
108 -
 109
109 -
 110
110 -
 111
111 -
 112
112 -
 113
113 -
 114
114 -
 115
115 -
116
-
117
-
118
-
119
-
120
-
121
-
122
-
123
-
124
-
125
-
126
-
127
-
128
-
129
-
130
-
131
-
132
-
133
-
134
-
135
-
136
-
137
-
138
-
139
-
140
-
141
-
142
-
143
-
144
-
145
-
146
-
147
-
148
-
149
-
150
-
151
-
152
-
153
-
154
-
155
-
156
-
157
-
158
-
159
-
160
-
161
-
162
-
163
-
164
-
165
-
166
-
167
-
168
-
169
-
170
-
171
-
172
-
173
-
174
-
175
-
176
-
177
-
178
-
179
-
180
-
181
-
182
-
183
-
184
-
185
-
186
-
187
-
188
-
189
-
190
-
191
-
192
-
193
-
194
-
195
-
196
-
197
-
198
-
199
-
200
-
201
-
202
-
203
-
204
-
205
-
206
-
207
-
208
-
209
-
210
-
211
-
212
-
213
-
214
-
215
-
216
-
217
-
218
-
219
-
220
-
221
-
222
-
223
-
224
-
225
-
226
-
227
-
228
-
229
-
230
-
231
-
232
-
233
-
234
-
235
-
236
-
237
-
238
-
239
-
240
-
241
-
242
-
243
-
244
-
245
-
246
-
247
-
248
-
249
-
250
-
251
-
252
-
253
-
254
-
255
-
256
-
257
-
258
-
259
-
260
-
261
-
262
-
263
-
264
-
265
-
266
-
267
-
268
-
269
-
270
-
271
-
272
-
273
-
274
-
275
-
276
-
277
-
278
-
279
-
280
-
281
-
282
-
283
-
284
-
285
-
286
-
287
-
288
-
289
-
290
-
291
-
292
-
293
-
294
-
295
-
296
-
297
-
298
-
299
-
300
-
301
-
302
-
303
-
304
-
305
-
306
-
307
-
308
-
309
-
310
-
311
-
312
-
313
-
314
-
315
-
316
-
317
-
318
-
319
-
320
-
321
-
322
-
323
-
324
-
325
-
326
-
327
-
328
-
329
-
330
-
331
-
332
-
333
-
334
-
335
-
336
-
337
-
338
-
339
-
340
-
341
-
342
-
343
-
344
-
345
-
346
-
347
-
348
-
349
-
350
-
351
-
352
-
353
-
354
-
355
-
356
-
357
-
358
-
359
-
360
-
361
-
362
-
363
-
364
-
365
-
366
-
367
-
368
-
369
-
370
-
371
-
372
-
373
-
374
-
375
-
376
-
377
-
378
-
379
-
380
-
381
-
382
-
383
-
384
-
385
-
386
-
387
-
388
-
389
-
390
-
391
-
392
-
393
-
394
-
395
-
396
-
397
-
398
-
399
-
400
-
401
-
402
-
403
-
404
-
405
-
406
-
407
-
408
-
409
-
410
-
411
-
412
-
413
-
414
-
415
-
416
-
417
-
418
-
419
-
420
-
421
-
422
-
423
-
424
-
425
-
426
-
427
-
428
-
429
-
430
-
431
-
432
-
433
-
434
-
435
-
436
-
437
-
438
-
439
-
440
-
441
-
442
-
443
-
444
-
445
-
446
-
447
-
448
-
449
-
450
-
451
-
452
-
453
-
454
-
455
-
456
-
457
-
458
-
459
-
460
-
461
-
462
-
463
-
464
-
465
-
466
-
467
-
468
-
469
-
470
-
471
-
472
-
473
-
474
-
475
-
476
 |
 |
103
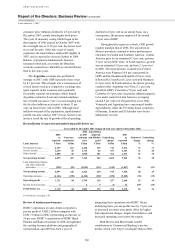
correspondent business, concentrated in second lien
and portions of first lien mortgages originated and
purchased in 2005 and 2006. As noted previously,
HSBC witnessed a deterioration in the performance
of these 2005 originations during the first half of
2006. This deterioration continued into the third
quarter and started to affect equivalent loans
originated in 2006. In the final quarter of 2006,
deterioration of these loans, largely the first lien
adjustable-rate and second lien loans, worsened
considerably. The heightened risk of loss was
attributable to lower equity in homes as price growth
moderated or reversed, together with a higher
prospective interest burden from ARM resets. As
many of these mortgages were being re-priced in an
environment of higher interest rates, slower asset
price appreciation and tightening credit, HSBC
considers it highly likely that these factors will lead
to increased instances of default in the future on both
first and any associated second lien loans.
Accordingly, a significant increase in loan
impairment charges was recorded in the final
quarter of the year.
Higher lending, the seasoning of the loan
portfolio, and a return to more normal historical
levels of delinquency from the exceptionally
favourable credit conditions experienced in recent
periods, all contributed to the overall increase in
impairment charges in the US. This was partly offset
by lower numbers and levels of bankruptcy filings
and the positive effect of low unemployment. The
credit card business, in addition, benefited from
improved recovery rates from loans previously
written off. Notwithstanding the accelerated credit
weakness witnessed in the mortgage services
correspondent business, credit performance as
measured by delinquency and loss in the majority of
the other lending portfolios, including mortgage
balances originated through the branch-based
consumer lending business gradually deteriorated
from the seasoning of a growing portfolio and the
rising proportion of credit card balances. Loan
impairment charges in these portfolios were
consequently higher in the second half of 2006 as
these portfolios seasoned, coinciding with the
weakening housing market.
In Canada, loan impairment charges were 38 per
cent higher. This primarily reflected the non-
recurrence of loan impairment releases from core
banking operations, which occurred in 2005, as well
as growth in both secured and unsecured lending
balances and higher delinquency rates in the motor
vehicle finance business.
Operating expenses grew by 12 per cent
to US$7.4 billion. In the US, costs of US$6.7 billion
were 11 per cent higher than in 2005. In the
consumer finance business, the rise was driven by
increased headcount to support incremental
collections activity, and greater volumes. Higher
costs were incurred in marketing cards to support the
launch of new co-branded credit cards, greater levels
of mailing and other promotional campaigns in the
cards and retail services businesses. IT and
administrative expenses grew in support of higher
asset balances. A lower level of deferred origination
costs in the mortgage services business, due to a
decline in volumes, contributed further to the cost
growth.
In HSBC Bank USA, expense growth was
primarily driven by branch staff costs from
additional headcount recruited to support investment
in business expansion and new branch openings.
Greater emphasis placed on increasing the quality
and number of branch staff dedicated to sales and
customer relationship activities, which changed the
staff mix, also contributed to cost growth. The
continued promotion of the online savings product,
new branch openings and branding initiatives at the
John F. Kennedy International and LaGuardia
airports in New York led to a rise in marketing costs.
IT costs also grew following significant investment
expenditure incurred on several key network
efficiency projects.
In Canada, costs rose by 19 per cent, mainly due
to higher staff and marketing costs. Staff costs grew
by 13 per cent, with increased headcount supporting
expansion of the consumer finance business and
bank distribution network. Continuing investment in
growing the wealth management business and higher
incentive costs reflecting improved revenues also
contributed to the increase. Marketing costs grew
following external campaigns to improve brand
awareness.
Commercial Banking’s pre-tax profits rose by
4 per cent to US$957 million, largely driven by
lending and deposit growth and higher fee income,
partly offset by increased loan impairment charges.
Costs rose mainly from geographical expansion in
the US and branch and business expansion in
Canada. The cost efficiency ratio worsened by
2.1 percentage points, as costs grew faster than
revenues.
Net interest income grew by 15 per cent to
US$1.4 billion. In the US, net interest income was
13 per cent higher, as HSBC continued to expand its
geographical presence, notably in Boston,
Connecticut, New Jersey, Philadelphia, Washington
D.C., Chicago and Los Angeles. Average deposit
balances rose by 30 per cent, aided by geographical