HSBC 2007 Annual Report Download - page 94
Download and view the complete annual report
Please find page 94 of the 2007 HSBC annual report below. You can navigate through the pages in the report by either clicking on the pages listed below, or by using the keyword search tool below to find specific information within the annual report.-
 1
1 -
2
-
3
-
4
-
5
-
6
-
7
-
8
-
9
-
10
-
11
-
12
-
13
-
14
-
15
-
16
-
17
-
18
-
19
-
20
-
21
-
22
-
23
-
24
-
25
-
26
-
27
-
28
-
29
-
30
-
31
-
32
-
33
-
34
-
35
-
36
-
37
-
38
-
39
-
40
-
41
-
42
-
43
-
44
-
45
-
46
-
47
-
48
-
49
-
50
-
51
-
52
-
53
-
54
-
55
-
56
-
57
-
58
-
59
-
60
-
61
-
62
-
63
-
64
-
65
-
66
-
67
-
68
-
69
-
70
-
71
-
72
-
73
-
74
-
75
-
76
-
77
-
78
-
79
-
80
-
81
-
82
-
83
-
 84
84 -
 85
85 -
 86
86 -
 87
87 -
 88
88 -
 89
89 -
 90
90 -
 91
91 -
 92
92 -
 93
93 -
 94
94 -
 95
95 -
 96
96 -
 97
97 -
 98
98 -
 99
99 -
 100
100 -
 101
101 -
 102
102 -
 103
103 -
 104
104 -
105
-
106
-
107
-
108
-
109
-
110
-
111
-
112
-
113
-
114
-
115
-
116
-
117
-
118
-
119
-
120
-
121
-
122
-
123
-
124
-
125
-
126
-
127
-
128
-
129
-
130
-
131
-
132
-
133
-
134
-
135
-
136
-
137
-
138
-
139
-
140
-
141
-
142
-
143
-
144
-
145
-
146
-
147
-
148
-
149
-
150
-
151
-
152
-
153
-
154
-
155
-
156
-
157
-
158
-
159
-
160
-
161
-
162
-
163
-
164
-
165
-
166
-
167
-
168
-
169
-
170
-
171
-
172
-
173
-
174
-
175
-
176
-
177
-
178
-
179
-
180
-
181
-
182
-
183
-
184
-
185
-
186
-
187
-
188
-
189
-
190
-
191
-
192
-
193
-
194
-
195
-
196
-
197
-
198
-
199
-
200
-
201
-
202
-
203
-
204
-
205
-
206
-
207
-
208
-
209
-
210
-
211
-
212
-
213
-
214
-
215
-
216
-
217
-
218
-
219
-
220
-
221
-
222
-
223
-
224
-
225
-
226
-
227
-
228
-
229
-
230
-
231
-
232
-
233
-
234
-
235
-
236
-
237
-
238
-
239
-
240
-
241
-
242
-
243
-
244
-
245
-
246
-
247
-
248
-
249
-
250
-
251
-
252
-
253
-
254
-
255
-
256
-
257
-
258
-
259
-
260
-
261
-
262
-
263
-
264
-
265
-
266
-
267
-
268
-
269
-
270
-
271
-
272
-
273
-
274
-
275
-
276
-
277
-
278
-
279
-
280
-
281
-
282
-
283
-
284
-
285
-
286
-
287
-
288
-
289
-
290
-
291
-
292
-
293
-
294
-
295
-
296
-
297
-
298
-
299
-
300
-
301
-
302
-
303
-
304
-
305
-
306
-
307
-
308
-
309
-
310
-
311
-
312
-
313
-
314
-
315
-
316
-
317
-
318
-
319
-
320
-
321
-
322
-
323
-
324
-
325
-
326
-
327
-
328
-
329
-
330
-
331
-
332
-
333
-
334
-
335
-
336
-
337
-
338
-
339
-
340
-
341
-
342
-
343
-
344
-
345
-
346
-
347
-
348
-
349
-
350
-
351
-
352
-
353
-
354
-
355
-
356
-
357
-
358
-
359
-
360
-
361
-
362
-
363
-
364
-
365
-
366
-
367
-
368
-
369
-
370
-
371
-
372
-
373
-
374
-
375
-
376
-
377
-
378
-
379
-
380
-
381
-
382
-
383
-
384
-
385
-
386
-
387
-
388
-
389
-
390
-
391
-
392
-
393
-
394
-
395
-
396
-
397
-
398
-
399
-
400
-
401
-
402
-
403
-
404
-
405
-
406
-
407
-
408
-
409
-
410
-
411
-
412
-
413
-
414
-
415
-
416
-
417
-
418
-
419
-
420
-
421
-
422
-
423
-
424
-
425
-
426
-
427
-
428
-
429
-
430
-
431
-
432
-
433
-
434
-
435
-
436
-
437
-
438
-
439
-
440
-
441
-
442
-
443
-
444
-
445
-
446
-
447
-
448
-
449
-
450
-
451
-
452
-
453
-
454
-
455
-
456
-
457
-
458
-
459
-
460
-
461
-
462
-
463
-
464
-
465
-
466
-
467
-
468
-
469
-
470
-
471
-
472
-
473
-
474
-
475
-
476
 |
 |

HSBC HOLDINGS PLC
Report of the Directors: Business Review (continued)
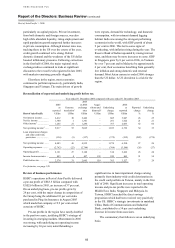
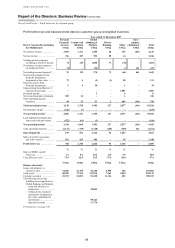
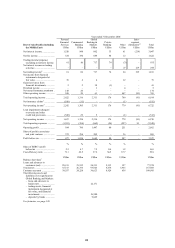
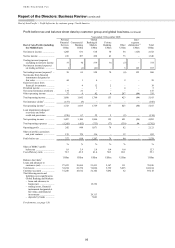
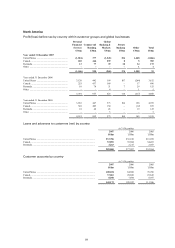
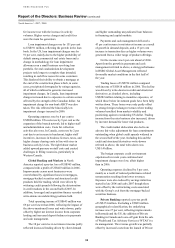
North America > Profit before tax / 2007
92
Profit before tax
Year ended 31 December
2007 2006 2005
North America US$m US$m US$m
Net interest income .......................................................................................... 14,847 14,268 13,295
Net fee income ................................................................................................. 5,810 4,766 3,952
Net trading income/(expense) ......................................................................... (542) 1,358 885
Net income/(expense) from financial instruments designated at fair value ... 1,750 (63) 434
Gains less losses from financial investments .................................................. 245 58 47
Dividend income .............................................................................................. 105 85 41
Net earned insurance premiums ...................................................................... 449 492 477
Other operating income ................................................................................... 360 922 642
Total operating income ................................................................................. 23,024 21,886 19,773
Net insurance claims incurred and movement in liabilities to policyholders.. (241) (259) (232)
Net operating income before loan impairment charges and other
credit risk provisions ................................................................................. 22,783 21,627 19,541
Loan impairment charges and other credit risk provisions ............................. (12,156) (6,796) (4,916)
Net operating income .................................................................................... 10,627 14,831 14,625
Total operating expenses ................................................................................. (10,556) (10,193) (8,758)
Operating profit ............................................................................................. 71 4,638 5,867
Share of profit in associates and joint ventures ............................................... 20 30 48
Profit before tax ............................................................................................. 91 4,668 5,915
%
%
%
Share of HSBC’s profit before tax .................................................................. 0.4
21.1
28.2
Cost efficiency ratio ........................................................................................ 46.3
47.1
44.8
Year-end staff numbers (full-time equivalent) ................................................ 52,722 55,642 53,608
Balance sheet data7
At 31 December
2007 2006 2005
US$m US$m US$m
Loans and advances to customers (net) ........................................................... 289,860 277,987 252,560
Loans and advances to banks (net) .................................................................. 16,566 17,865 10,331
Trading assets, financial instruments designated at fair value, and
financial investments16 ................................................................................ 133,998 145,700 112,225
Total assets ...................................................................................................... 510,092 511,190 432,490
Deposits by banks ............................................................................................ 16,618 11,484 7,780
Customer accounts ........................................................................................... 145,173 120,922 111,386
For footnotes, see page 130.
Year ended 31 December 2007 compared
with year ended 31 December 2006
Economic briefing
In the US, GDP growth in 2007 was 2.2 per cent,
0.7 percentage points less than that recorded in 2006
as the housing-led downturn gathered pace.
Consumer spending in 2007 grew by 2.9 per cent,
the weakest annual expansion since 2003. Housing
activity continued to weaken in 2007, with
residential investment falling by 17 per cent during
the year. Both new and existing home sales also
declined to new lows in 2007. The unemployment
rate averaged 4.6 per cent in 2007, with the average
in the second half of the year slightly higher at
4.8 per cent. The trade deficit narrowed in 2007 as
export growth strengthened. Consumer price
inflation averaged around 4 per cent in the final
quarter of 2007. This was largely due to higher
energy prices; excluding food and energy, consumer
price inflation averaged 2.3 per cent in the fourth
quarter. The Federal Reserve lowered short-term
interest rates by 100 basis points in the second half
of 2007, from 5.25 per cent to 4.25 per cent, as
policymakers attempted to mitigate the worst effects
of the sub-prime related credit squeeze upon
economic activity. 10-year note yields reached a
high of 5.3 per cent in June 2007, before falling to