HSBC 2007 Annual Report Download - page 100
Download and view the complete annual report
Please find page 100 of the 2007 HSBC annual report below. You can navigate through the pages in the report by either clicking on the pages listed below, or by using the keyword search tool below to find specific information within the annual report.-
 1
1 -
2
-
3
-
4
-
5
-
6
-
7
-
8
-
9
-
10
-
11
-
12
-
13
-
14
-
15
-
16
-
17
-
18
-
19
-
20
-
21
-
22
-
23
-
24
-
25
-
26
-
27
-
28
-
29
-
30
-
31
-
32
-
33
-
34
-
35
-
36
-
37
-
38
-
39
-
40
-
41
-
42
-
43
-
44
-
45
-
46
-
47
-
48
-
49
-
50
-
51
-
52
-
53
-
54
-
55
-
56
-
57
-
58
-
59
-
60
-
61
-
62
-
63
-
64
-
65
-
66
-
67
-
68
-
69
-
70
-
71
-
72
-
73
-
74
-
75
-
76
-
77
-
78
-
79
-
80
-
81
-
82
-
83
-
84
-
85
-
86
-
87
-
88
-
89
-
 90
90 -
 91
91 -
 92
92 -
 93
93 -
 94
94 -
 95
95 -
 96
96 -
 97
97 -
 98
98 -
 99
99 -
 100
100 -
 101
101 -
 102
102 -
 103
103 -
 104
104 -
 105
105 -
 106
106 -
 107
107 -
 108
108 -
 109
109 -
 110
110 -
111
-
112
-
113
-
114
-
115
-
116
-
117
-
118
-
119
-
120
-
121
-
122
-
123
-
124
-
125
-
126
-
127
-
128
-
129
-
130
-
131
-
132
-
133
-
134
-
135
-
136
-
137
-
138
-
139
-
140
-
141
-
142
-
143
-
144
-
145
-
146
-
147
-
148
-
149
-
150
-
151
-
152
-
153
-
154
-
155
-
156
-
157
-
158
-
159
-
160
-
161
-
162
-
163
-
164
-
165
-
166
-
167
-
168
-
169
-
170
-
171
-
172
-
173
-
174
-
175
-
176
-
177
-
178
-
179
-
180
-
181
-
182
-
183
-
184
-
185
-
186
-
187
-
188
-
189
-
190
-
191
-
192
-
193
-
194
-
195
-
196
-
197
-
198
-
199
-
200
-
201
-
202
-
203
-
204
-
205
-
206
-
207
-
208
-
209
-
210
-
211
-
212
-
213
-
214
-
215
-
216
-
217
-
218
-
219
-
220
-
221
-
222
-
223
-
224
-
225
-
226
-
227
-
228
-
229
-
230
-
231
-
232
-
233
-
234
-
235
-
236
-
237
-
238
-
239
-
240
-
241
-
242
-
243
-
244
-
245
-
246
-
247
-
248
-
249
-
250
-
251
-
252
-
253
-
254
-
255
-
256
-
257
-
258
-
259
-
260
-
261
-
262
-
263
-
264
-
265
-
266
-
267
-
268
-
269
-
270
-
271
-
272
-
273
-
274
-
275
-
276
-
277
-
278
-
279
-
280
-
281
-
282
-
283
-
284
-
285
-
286
-
287
-
288
-
289
-
290
-
291
-
292
-
293
-
294
-
295
-
296
-
297
-
298
-
299
-
300
-
301
-
302
-
303
-
304
-
305
-
306
-
307
-
308
-
309
-
310
-
311
-
312
-
313
-
314
-
315
-
316
-
317
-
318
-
319
-
320
-
321
-
322
-
323
-
324
-
325
-
326
-
327
-
328
-
329
-
330
-
331
-
332
-
333
-
334
-
335
-
336
-
337
-
338
-
339
-
340
-
341
-
342
-
343
-
344
-
345
-
346
-
347
-
348
-
349
-
350
-
351
-
352
-
353
-
354
-
355
-
356
-
357
-
358
-
359
-
360
-
361
-
362
-
363
-
364
-
365
-
366
-
367
-
368
-
369
-
370
-
371
-
372
-
373
-
374
-
375
-
376
-
377
-
378
-
379
-
380
-
381
-
382
-
383
-
384
-
385
-
386
-
387
-
388
-
389
-
390
-
391
-
392
-
393
-
394
-
395
-
396
-
397
-
398
-
399
-
400
-
401
-
402
-
403
-
404
-
405
-
406
-
407
-
408
-
409
-
410
-
411
-
412
-
413
-
414
-
415
-
416
-
417
-
418
-
419
-
420
-
421
-
422
-
423
-
424
-
425
-
426
-
427
-
428
-
429
-
430
-
431
-
432
-
433
-
434
-
435
-
436
-
437
-
438
-
439
-
440
-
441
-
442
-
443
-
444
-
445
-
446
-
447
-
448
-
449
-
450
-
451
-
452
-
453
-
454
-
455
-
456
-
457
-
458
-
459
-
460
-
461
-
462
-
463
-
464
-
465
-
466
-
467
-
468
-
469
-
470
-
471
-
472
-
473
-
474
-
475
-
476
 |
 |

HSBC HOLDINGS PLC
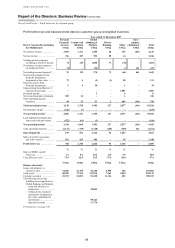
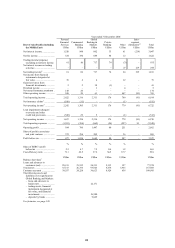
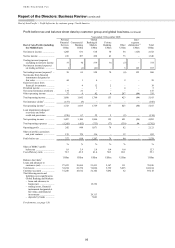
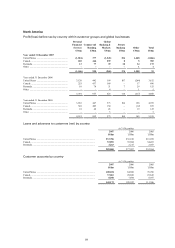
Report of the Directors: Business Review (continued)
North America > 2007 / 2006
98
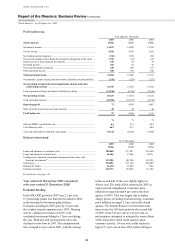
fee income rose with the increase in activity
volumes. Higher service charges and credit fees
were the main fee generators.
Loan impairment charges rose by 151 per cent
to US$191 million, reflecting the growth in the loan
book. In the US, loan impairment charges rose by
91 per cent, mainly due to the higher probability of
default among commercial real estate loans and a
change in methodology for loan impairment
allowances on a small business revolving loan
portfolio. Several condominium development
projects took longer to complete than intended,
resulting in cash flow issues for some customers.
This hindered their ability to obtain a mortgage at
the end of the construction phase which, in some
cases, precipitated downgrades by ratings agencies,
all of which combined to generate increased
impairment charges. In Canada, loan impairment
charges increased due to exposures to certain sectors
affected by the strength of the Canadian dollar. An
impairment charge for non-bank ABCP was also
taken. The risk reflected the historically low
impairment charges incurred in 2006.
Operating expenses rose by 8 per cent to
US$893million. US costs rose by 9 per cent as the
expansion of the branch network led to higher staff
and administration costs. Costs for collection
activities also rose. In Canada, costs rose by 2 per
cent due to an increase in headcount, higher staff
incentives, increases in business licenses, taxes, and
higher cheque clearing costs in line with rises in
business activity levels. The tight labour market
added upward pressure on staff costs and created
challenges in filling vacancies, particularly in
Western Canada.
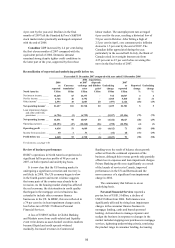
Global Banking and Markets in North
America reported a pre-tax loss of US$965 million,
compared with a profit of US$423 million in 2006.
Improvements across most businesses were
overwhelmed by significant losses in mortgages,
mortgage-backed securities and structured credit
products held for trading, which were driven by
widening credit spreads following the deterioration
in credit markets in the second half of 2007. In
addition, leveraged and acquisition finance recorded
write-downs on underwriting positions held.
Total operating income of US$645 million was
69 per cent lower than 2006, reflecting the impact of
the above-mentioned losses and write-downs, partly
offset by higher net interest income from corporate
lending and increased deposit balances in payments
and cash management.
The 38 per cent rise in net interest income partly
reflected increased lending driven by client demand
and higher outstanding unsyndicated loan balances
in financing and capital markets.
Payments and cash management delivered a
43 per cent increase in net interest income as a result
of growth in demand deposits, and a 15 per cent
increase in transaction fees as higher volumes were
generated from a wider range of product offerings.
Net fee income was 6 per cent ahead of 2006.
Apart from the growth in payments and cash
management referred to above, a strong performance
in HSBC Global Asset Management reflected
favourable market conditions in the first half of
the year.
Trading losses of US$734 million compared
with income of US$818 million in 2006. The decline
was driven by write-downs in credit and structured
derivatives, as detailed above, including
US$282 million relating to monoline exposures, of
which those below investment grade have been fully
written down. These losses were only partly offset
by strong foreign exchange revenues where trading
volumes benefited from market volatility and
positioning against a weakening US dollar. Trading
income from the rates business also increased, driven
by investor demand for lower risk products.
The credit market dislocation also led to an
adverse fair value adjustment for loan commitments
outstanding when global credit spreads widened in
the second half of the year. Including this and the
credit and structured derivatives write-downs
referred to above, the total write-down was
US$1.4 billion.
The benign corporate credit environment
experienced in recent years continued and
impairment charges were low, albeit higher
than in 2006.
Operating expenses declined by 5 per cent,
mainly as a result of reduced performance-related
remuneration resulting from lower revenues.
Expenses were also reduced by savings initiatives
started in late 2006 and early 2007 though these
were offset by the restructuring costs associated
with the Group’s exit from the mortgage-backed
securities business.
Private Banking reported a pre-tax profit
of US$174 million. Excluding a US$39 million
geographical reclassification, the underlying
increase was 27 per cent, reflecting improvements
in Bermuda and the US, the addition of Private
Banking in Canada and a one-off gain from the sale
of Wealth and Tax Advisory Services (‘WTAS’) to
its management. The revenue growth was partially
offset by increased costs from the launch of Private