HSBC 2007 Annual Report Download - page 288
Download and view the complete annual report
Please find page 288 of the 2007 HSBC annual report below. You can navigate through the pages in the report by either clicking on the pages listed below, or by using the keyword search tool below to find specific information within the annual report.-
 1
1 -
2
-
3
-
4
-
5
-
6
-
7
-
8
-
9
-
10
-
11
-
12
-
13
-
14
-
15
-
16
-
17
-
18
-
19
-
20
-
21
-
22
-
23
-
24
-
25
-
26
-
27
-
28
-
29
-
30
-
31
-
32
-
33
-
34
-
35
-
36
-
37
-
38
-
39
-
40
-
41
-
42
-
43
-
44
-
45
-
46
-
47
-
48
-
49
-
50
-
51
-
52
-
53
-
54
-
55
-
56
-
57
-
58
-
59
-
60
-
61
-
62
-
63
-
64
-
65
-
66
-
67
-
68
-
69
-
70
-
71
-
72
-
73
-
74
-
75
-
76
-
77
-
78
-
79
-
80
-
81
-
82
-
83
-
84
-
85
-
86
-
87
-
88
-
89
-
90
-
91
-
92
-
93
-
94
-
95
-
96
-
97
-
98
-
99
-
100
-
101
-
102
-
103
-
104
-
105
-
106
-
107
-
108
-
109
-
110
-
111
-
112
-
113
-
114
-
115
-
116
-
117
-
118
-
119
-
120
-
121
-
122
-
123
-
124
-
125
-
126
-
127
-
128
-
129
-
130
-
131
-
132
-
133
-
134
-
135
-
136
-
137
-
138
-
139
-
140
-
141
-
142
-
143
-
144
-
145
-
146
-
147
-
148
-
149
-
150
-
151
-
152
-
153
-
154
-
155
-
156
-
157
-
158
-
159
-
160
-
161
-
162
-
163
-
164
-
165
-
166
-
167
-
168
-
169
-
170
-
171
-
172
-
173
-
174
-
175
-
176
-
177
-
178
-
179
-
180
-
181
-
182
-
183
-
184
-
185
-
186
-
187
-
188
-
189
-
190
-
191
-
192
-
193
-
194
-
195
-
196
-
197
-
198
-
199
-
200
-
201
-
202
-
203
-
204
-
205
-
206
-
207
-
208
-
209
-
210
-
211
-
212
-
213
-
214
-
215
-
216
-
217
-
218
-
219
-
220
-
221
-
222
-
223
-
224
-
225
-
226
-
227
-
228
-
229
-
230
-
231
-
232
-
233
-
234
-
235
-
236
-
237
-
238
-
239
-
240
-
241
-
242
-
243
-
244
-
245
-
246
-
247
-
248
-
249
-
250
-
251
-
252
-
253
-
254
-
255
-
256
-
257
-
258
-
259
-
260
-
261
-
262
-
263
-
264
-
265
-
266
-
267
-
268
-
269
-
270
-
271
-
272
-
273
-
274
-
275
-
276
-
277
-
 278
278 -
 279
279 -
 280
280 -
 281
281 -
 282
282 -
 283
283 -
 284
284 -
 285
285 -
 286
286 -
 287
287 -
 288
288 -
 289
289 -
 290
290 -
 291
291 -
 292
292 -
 293
293 -
 294
294 -
 295
295 -
 296
296 -
 297
297 -
 298
298 -
299
-
300
-
301
-
302
-
303
-
304
-
305
-
306
-
307
-
308
-
309
-
310
-
311
-
312
-
313
-
314
-
315
-
316
-
317
-
318
-
319
-
320
-
321
-
322
-
323
-
324
-
325
-
326
-
327
-
328
-
329
-
330
-
331
-
332
-
333
-
334
-
335
-
336
-
337
-
338
-
339
-
340
-
341
-
342
-
343
-
344
-
345
-
346
-
347
-
348
-
349
-
350
-
351
-
352
-
353
-
354
-
355
-
356
-
357
-
358
-
359
-
360
-
361
-
362
-
363
-
364
-
365
-
366
-
367
-
368
-
369
-
370
-
371
-
372
-
373
-
374
-
375
-
376
-
377
-
378
-
379
-
380
-
381
-
382
-
383
-
384
-
385
-
386
-
387
-
388
-
389
-
390
-
391
-
392
-
393
-
394
-
395
-
396
-
397
-
398
-
399
-
400
-
401
-
402
-
403
-
404
-
405
-
406
-
407
-
408
-
409
-
410
-
411
-
412
-
413
-
414
-
415
-
416
-
417
-
418
-
419
-
420
-
421
-
422
-
423
-
424
-
425
-
426
-
427
-
428
-
429
-
430
-
431
-
432
-
433
-
434
-
435
-
436
-
437
-
438
-
439
-
440
-
441
-
442
-
443
-
444
-
445
-
446
-
447
-
448
-
449
-
450
-
451
-
452
-
453
-
454
-
455
-
456
-
457
-
458
-
459
-
460
-
461
-
462
-
463
-
464
-
465
-
466
-
467
-
468
-
469
-
470
-
471
-
472
-
473
-
474
-
475
-
476
 |
 |

HSBC HOLDINGS PLC
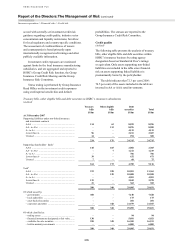
Report of the Directors: The Management of Risk (continued)
Capital management and allocation > RWAs
286
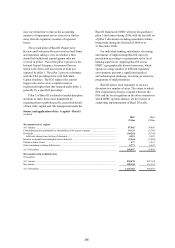
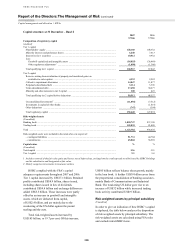
Capital structure at 31 December – Basel I
2007
US$m
2006
US$m
Composition of regulatory capital
(Audited)
Tier 1 capital
Shareholders’ equity ........................................................................................................................ 128,160 108,352
Minority interests and preference shares ........................................................................................ 6,240 7,413
Innovative tier 1 securities .............................................................................................................. 10,512 9,932
Less:
Goodwill capitalised and intangible assets ................................................................................. (38,855) (36,489)
Other regulatory adjustments1 .................................................................................................... (1,090) (1,366)
Total qualifying tier 1 capital .......................................................................................................... 104,967 87,842
Tier 2 capital
Reserves arising from revaluation of property and unrealised gains on
available-for-sale equities ........................................................................................................... 4,393 2,982
Collective impairment allowances .................................................................................................. 14,047 11,077
Perpetual subordinated debt ............................................................................................................ 3,114 3,396
Term subordinated debt ................................................................................................................... 37,658 30,677
Minority and other interests in tier 2 capital ................................................................................... 300 425
Total qualifying tier 2 capital before deductions ............................................................................ 59,512 48,557
Unconsolidated investments2 .......................................................................................................... (11,092) (7,512)
Investments in capital of other banks .............................................................................................. – (1,419)
Other deductions ............................................................................................................................. (747) (394)
Total regulatory capital ................................................................................................................... 152,640 127,074
Risk-weighted assets
(Unaudited)
Banking book ....................................................................................................................................... 1,020,747 857,198
Trading book ........................................................................................................................................ 103,035 81,480
Total ..................................................................................................................................................... 1,123,782 938,678
Risk-weighted assets were included in the totals above in respect of:
– contingent liabilities ..................................................................................................................... 51,731 44,704
– commitments ................................................................................................................................ 65,068 58,569
Capital ratios % %
(Unaudited)
Total capital ......................................................................................................................................... 13.6 13.5
Tier 1 capital ........................................................................................................................................ 9.3 9.4
1 Includes removal of the fair value gains and losses, net of deferred tax, arising from the credit spreads on debt issued by HSBC Holdings
and its subsidiaries and designated at fair value.
2 Mainly comprises investments in insurance entities.
HSBC complied with the FSA’s capital
adequacy requirements throughout 2007 and 2006.
Tier 1 capital increased by US$17.1 billion. Retained
profits contributed US$8.9 billion, shares issued,
including shares issued in lieu of dividends,
contributed US$4.8 billion and exchange differences
added US$5.5 billion. These increases were partly
offset by an increase in goodwill and intangible
assets, which are deducted from capital,
of US$2.4 billion, and are mainly due to the
weakening of the US dollar against the pound
sterling and the euro.
Total risk-weighted assets increased by
US$185 billion, or 19.7 per cent. Of this increase,
US$95 billion reflects balance sheet growth, mainly
in the loan book. A further US$39 billion arose from
the proportional consolidation of banking associates,
mainly Bank of Communications and Industrial
Bank. The weakening US dollar gave rise to an
increase of US$32 billion while increased trading
book activity contributed US$19 billion.
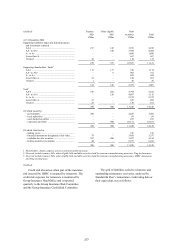
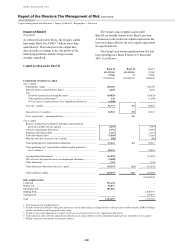
Risk-weighted assets by principal subsidiary
(Unaudited)
In order to give an indication of how HSBC’s capital
is deployed, the table below analyses the disposition
of risk-weighted assets by principal subsidiary. The
risk-weighted assets are calculated using FSA rules
and exclude intra-HSBC items.