HSBC 2007 Annual Report Download - page 34
Download and view the complete annual report
Please find page 34 of the 2007 HSBC annual report below. You can navigate through the pages in the report by either clicking on the pages listed below, or by using the keyword search tool below to find specific information within the annual report.-
 1
1 -
2
-
3
-
4
-
5
-
6
-
7
-
8
-
9
-
10
-
11
-
12
-
13
-
14
-
15
-
16
-
17
-
18
-
19
-
20
-
21
-
22
-
23
-
 24
24 -
 25
25 -
 26
26 -
 27
27 -
 28
28 -
 29
29 -
 30
30 -
 31
31 -
 32
32 -
 33
33 -
 34
34 -
 35
35 -
 36
36 -
 37
37 -
 38
38 -
 39
39 -
 40
40 -
 41
41 -
 42
42 -
 43
43 -
 44
44 -
45
-
46
-
47
-
48
-
49
-
50
-
51
-
52
-
53
-
54
-
55
-
56
-
57
-
58
-
59
-
60
-
61
-
62
-
63
-
64
-
65
-
66
-
67
-
68
-
69
-
70
-
71
-
72
-
73
-
74
-
75
-
76
-
77
-
78
-
79
-
80
-
81
-
82
-
83
-
84
-
85
-
86
-
87
-
88
-
89
-
90
-
91
-
92
-
93
-
94
-
95
-
96
-
97
-
98
-
99
-
100
-
101
-
102
-
103
-
104
-
105
-
106
-
107
-
108
-
109
-
110
-
111
-
112
-
113
-
114
-
115
-
116
-
117
-
118
-
119
-
120
-
121
-
122
-
123
-
124
-
125
-
126
-
127
-
128
-
129
-
130
-
131
-
132
-
133
-
134
-
135
-
136
-
137
-
138
-
139
-
140
-
141
-
142
-
143
-
144
-
145
-
146
-
147
-
148
-
149
-
150
-
151
-
152
-
153
-
154
-
155
-
156
-
157
-
158
-
159
-
160
-
161
-
162
-
163
-
164
-
165
-
166
-
167
-
168
-
169
-
170
-
171
-
172
-
173
-
174
-
175
-
176
-
177
-
178
-
179
-
180
-
181
-
182
-
183
-
184
-
185
-
186
-
187
-
188
-
189
-
190
-
191
-
192
-
193
-
194
-
195
-
196
-
197
-
198
-
199
-
200
-
201
-
202
-
203
-
204
-
205
-
206
-
207
-
208
-
209
-
210
-
211
-
212
-
213
-
214
-
215
-
216
-
217
-
218
-
219
-
220
-
221
-
222
-
223
-
224
-
225
-
226
-
227
-
228
-
229
-
230
-
231
-
232
-
233
-
234
-
235
-
236
-
237
-
238
-
239
-
240
-
241
-
242
-
243
-
244
-
245
-
246
-
247
-
248
-
249
-
250
-
251
-
252
-
253
-
254
-
255
-
256
-
257
-
258
-
259
-
260
-
261
-
262
-
263
-
264
-
265
-
266
-
267
-
268
-
269
-
270
-
271
-
272
-
273
-
274
-
275
-
276
-
277
-
278
-
279
-
280
-
281
-
282
-
283
-
284
-
285
-
286
-
287
-
288
-
289
-
290
-
291
-
292
-
293
-
294
-
295
-
296
-
297
-
298
-
299
-
300
-
301
-
302
-
303
-
304
-
305
-
306
-
307
-
308
-
309
-
310
-
311
-
312
-
313
-
314
-
315
-
316
-
317
-
318
-
319
-
320
-
321
-
322
-
323
-
324
-
325
-
326
-
327
-
328
-
329
-
330
-
331
-
332
-
333
-
334
-
335
-
336
-
337
-
338
-
339
-
340
-
341
-
342
-
343
-
344
-
345
-
346
-
347
-
348
-
349
-
350
-
351
-
352
-
353
-
354
-
355
-
356
-
357
-
358
-
359
-
360
-
361
-
362
-
363
-
364
-
365
-
366
-
367
-
368
-
369
-
370
-
371
-
372
-
373
-
374
-
375
-
376
-
377
-
378
-
379
-
380
-
381
-
382
-
383
-
384
-
385
-
386
-
387
-
388
-
389
-
390
-
391
-
392
-
393
-
394
-
395
-
396
-
397
-
398
-
399
-
400
-
401
-
402
-
403
-
404
-
405
-
406
-
407
-
408
-
409
-
410
-
411
-
412
-
413
-
414
-
415
-
416
-
417
-
418
-
419
-
420
-
421
-
422
-
423
-
424
-
425
-
426
-
427
-
428
-
429
-
430
-
431
-
432
-
433
-
434
-
435
-
436
-
437
-
438
-
439
-
440
-
441
-
442
-
443
-
444
-
445
-
446
-
447
-
448
-
449
-
450
-
451
-
452
-
453
-
454
-
455
-
456
-
457
-
458
-
459
-
460
-
461
-
462
-
463
-
464
-
465
-
466
-
467
-
468
-
469
-
470
-
471
-
472
-
473
-
474
-
475
-
476
 |
 |

HSBC HOLDINGS PLC
Report of the Directors: Business Review (continued)
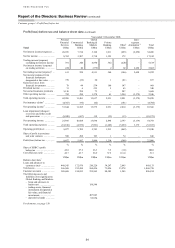
Business highlights / Profit/(loss) before tax
32
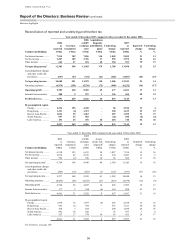
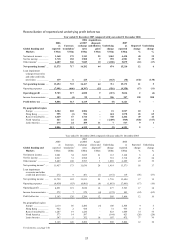
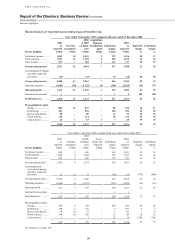
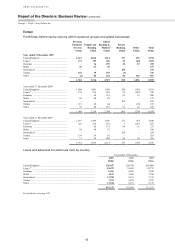
Reconciliation of reported and underlying profit before tax
Year ended 31 December 2007 compared with year ended 31 December 2006
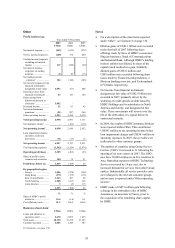
Other
2006
as
reported
US$m
Currency
translation1
US$m
2006
at 2007
exchange
rates
US$m
Acquisitions,
disposals
and dilution
gains2
US$m
Underlying
change
US$m
2007
as
reported
US$m
Reported
change
%
Underlying
change
%
Net interest expense ........ (625) (22) (647) – 105 (542) 13 16
Net fee income/(expense). 172 25 197 – (425) (228) (233) (216)
Other income3 ................. 3,263 77 3,340 1,092 3,296 7,728 137 99
Net operating income4... 2,810 80 2,890 1,092 2,976 6,958 148 103
Loan impairment charges
and other credit risk
provisions ................... (13) 3 (10) – (1) (11) 15 (10)
Net operating income .... 2,797 83 2,880 1,092 2,975 6,947 148 103
Operating expenses ......... (3,259) (90) (3,349) – (213) (3,562) (9) (6)
Operating profit/(loss) .. (462) (7) (469) 1,092 2,762 3,385 833 589
Income from associates .. 74 2 76 (50) 124 150 103 163
Profit/(loss) before tax .. (388) (5) (393) 1,042 2,886 3,535 1,011 734
By geographical region
Europe ......................... (278) (24) (302) (50) 1,408 1,056 480 466
Hong Kong ................. (175) 2 (173) – (202) (375) (114) (117)
Rest of Asia-Pacific .... 287 17 304 1,081 (42) 1,343 368 (14)
North America ............ (217) – (217) – 1,725 1,508 795 795
Latin America ............. (5) – (5) 11 (3) 3 160 (60)
(388) (5) (393) 1,042 2,886 3,535 1,011 734
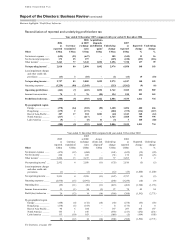
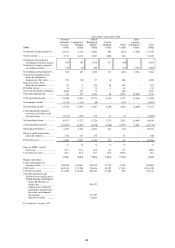
Year ended 31 December 2006 compared with year ended 31 December 2005
Other
2005
as
reported
US$m
Currency
translation1
US$m
2005
at 2006
exchange
rates
US$m
Acqui-
sitions and
disposals2
US$m
Underlying
change
US$m
2006
as
reported
US$m
Reported
change
%
Underlying
change
%
Net interest expense ........ (472) (12) (484) – (141) (625) (32) (29)
Net fee income ................ 220 3 223 – (51) 172 (22) (23)
Other income3 ................. 3,204 13 3,217 (11) 57 3,263 2 2
Net operating income4 .... 2,952 4 2,956 (11) (135) 2,810 (5) (5)
Loan impairment charges
and other credit risk
provisions (1) – (1) – (12) (13) (1,200) (1,200)
Net operating income ...... 2,951 4 2,955 (11) (147) 2,797 (5) (5)
Operating expenses ......... (2,976) (15) (2,991) – (268) (3,259) (10) (9)
Operating loss ................. (25) (11) (36) (11) (415) (462) (1,748) (1,153)
Income from associates .. 51 (1) 50 (3) 27 74 45 54
Profit/(loss) before tax .... 26 (12) 14 (14) (388) (388) (1,592) (2,771)
By geographical region
Europe ......................... (168) (4) (172) (14) (92) (278) (65) (53)
Hong Kong ................. (178) (5) (183) – 8 (175) 2 4
Rest of Asia-Pacific .... 94 6 100 – 187 287 205 187
North America ............ 165 1 166 – (383) (217) (232) (231)
Latin America ............. 113 (10) 103 – (108) (5) (104) (105)
26 (12) 14 (14) (388) (388) (1,592) (2,771)
For footnotes, see page 130.