HSBC 2007 Annual Report Download - page 251
Download and view the complete annual report
Please find page 251 of the 2007 HSBC annual report below. You can navigate through the pages in the report by either clicking on the pages listed below, or by using the keyword search tool below to find specific information within the annual report.-
 1
1 -
2
-
3
-
4
-
5
-
6
-
7
-
8
-
9
-
10
-
11
-
12
-
13
-
14
-
15
-
16
-
17
-
18
-
19
-
20
-
21
-
22
-
23
-
24
-
25
-
26
-
27
-
28
-
29
-
30
-
31
-
32
-
33
-
34
-
35
-
36
-
37
-
38
-
39
-
40
-
41
-
42
-
43
-
44
-
45
-
46
-
47
-
48
-
49
-
50
-
51
-
52
-
53
-
54
-
55
-
56
-
57
-
58
-
59
-
60
-
61
-
62
-
63
-
64
-
65
-
66
-
67
-
68
-
69
-
70
-
71
-
72
-
73
-
74
-
75
-
76
-
77
-
78
-
79
-
80
-
81
-
82
-
83
-
84
-
85
-
86
-
87
-
88
-
89
-
90
-
91
-
92
-
93
-
94
-
95
-
96
-
97
-
98
-
99
-
100
-
101
-
102
-
103
-
104
-
105
-
106
-
107
-
108
-
109
-
110
-
111
-
112
-
113
-
114
-
115
-
116
-
117
-
118
-
119
-
120
-
121
-
122
-
123
-
124
-
125
-
126
-
127
-
128
-
129
-
130
-
131
-
132
-
133
-
134
-
135
-
136
-
137
-
138
-
139
-
140
-
141
-
142
-
143
-
144
-
145
-
146
-
147
-
148
-
149
-
150
-
151
-
152
-
153
-
154
-
155
-
156
-
157
-
158
-
159
-
160
-
161
-
162
-
163
-
164
-
165
-
166
-
167
-
168
-
169
-
170
-
171
-
172
-
173
-
174
-
175
-
176
-
177
-
178
-
179
-
180
-
181
-
182
-
183
-
184
-
185
-
186
-
187
-
188
-
189
-
190
-
191
-
192
-
193
-
194
-
195
-
196
-
197
-
198
-
199
-
200
-
201
-
202
-
203
-
204
-
205
-
206
-
207
-
208
-
209
-
210
-
211
-
212
-
213
-
214
-
215
-
216
-
217
-
218
-
219
-
220
-
221
-
222
-
223
-
224
-
225
-
226
-
227
-
228
-
229
-
230
-
231
-
232
-
233
-
234
-
235
-
236
-
237
-
238
-
239
-
240
-
 241
241 -
 242
242 -
 243
243 -
 244
244 -
 245
245 -
 246
246 -
 247
247 -
 248
248 -
 249
249 -
 250
250 -
 251
251 -
 252
252 -
 253
253 -
 254
254 -
 255
255 -
 256
256 -
 257
257 -
 258
258 -
 259
259 -
 260
260 -
 261
261 -
262
-
263
-
264
-
265
-
266
-
267
-
268
-
269
-
270
-
271
-
272
-
273
-
274
-
275
-
276
-
277
-
278
-
279
-
280
-
281
-
282
-
283
-
284
-
285
-
286
-
287
-
288
-
289
-
290
-
291
-
292
-
293
-
294
-
295
-
296
-
297
-
298
-
299
-
300
-
301
-
302
-
303
-
304
-
305
-
306
-
307
-
308
-
309
-
310
-
311
-
312
-
313
-
314
-
315
-
316
-
317
-
318
-
319
-
320
-
321
-
322
-
323
-
324
-
325
-
326
-
327
-
328
-
329
-
330
-
331
-
332
-
333
-
334
-
335
-
336
-
337
-
338
-
339
-
340
-
341
-
342
-
343
-
344
-
345
-
346
-
347
-
348
-
349
-
350
-
351
-
352
-
353
-
354
-
355
-
356
-
357
-
358
-
359
-
360
-
361
-
362
-
363
-
364
-
365
-
366
-
367
-
368
-
369
-
370
-
371
-
372
-
373
-
374
-
375
-
376
-
377
-
378
-
379
-
380
-
381
-
382
-
383
-
384
-
385
-
386
-
387
-
388
-
389
-
390
-
391
-
392
-
393
-
394
-
395
-
396
-
397
-
398
-
399
-
400
-
401
-
402
-
403
-
404
-
405
-
406
-
407
-
408
-
409
-
410
-
411
-
412
-
413
-
414
-
415
-
416
-
417
-
418
-
419
-
420
-
421
-
422
-
423
-
424
-
425
-
426
-
427
-
428
-
429
-
430
-
431
-
432
-
433
-
434
-
435
-
436
-
437
-
438
-
439
-
440
-
441
-
442
-
443
-
444
-
445
-
446
-
447
-
448
-
449
-
450
-
451
-
452
-
453
-
454
-
455
-
456
-
457
-
458
-
459
-
460
-
461
-
462
-
463
-
464
-
465
-
466
-
467
-
468
-
469
-
470
-
471
-
472
-
473
-
474
-
475
-
476
 |
 |

249
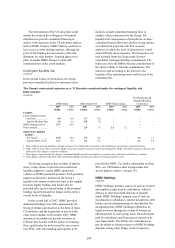
Non-trading portfolios include positions that
arise from the interest rate management of HSBC’s
retail and commercial banking assets and liabilities,
financial investments designated as available for sale
and held to maturity, and exposures arising from
HSBC’s insurance operations.
Market risk arising in HSBC’s insurance
businesses is discussed in ‘Risk management of
insurance operations’ on pages 272 to 275.
The management of market risk is principally
undertaken in Global Markets using risk limits
approved by the Group Management Board. Limits
are set for portfolios, products and risk types, with
market liquidity being a principal factor in
determining the level of limits set. Traded Credit and
Market Risk, an independent unit within the Group
Management Office, develops the Group’s market
risk management policies and measurement
techniques. Each major operating entity has an
independent market risk management and control
function which is responsible for measuring market
risk exposures in accordance with the policies
defined by Traded Credit and Market Risk, and
monitoring and reporting these exposures against the
prescribed limits on a daily basis.
Each operating entity is required to assess the
market risks which arise on each product in its
business and to transfer these risks to either its local
Global Markets unit for management, or to separate
books managed under the supervision of the local
Asset and Liability Management Committee
(‘ALCO’). The aim is to ensure that all market risks
are consolidated within operations which have the
necessary skills, tools, management and governance
to manage such risks professionally. In certain cases
where the market risks cannot be adequately
captured by the transfer process, simulation
modelling is used to identify the impact of varying
scenarios on valuations and net interest income.
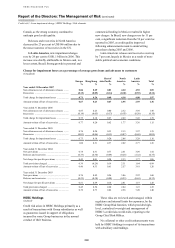
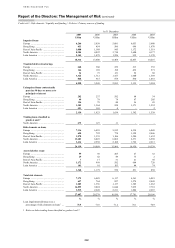
HSBC uses a range of tools to monitor and limit
market risk exposures. These include value at risk
(‘VAR’), sensitivity analysis and stress testing. The
following table provides an overview of the
reporting of risks within this section:
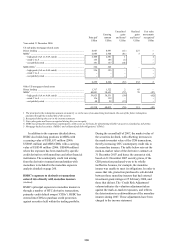
Portfolio
Trading Non-trading
Risk type
Foreign exchange ............... VAR VAR1
Interest rate ........................ VAR VAR2
Commodity ........................ VAR N/A
Equity ................................. VAR Sensitivity
Credit spread ...................... Sensitivity Sensitivity3
1 The structural foreign exchange risk is not included within
VAR. This is discussed on page 256.
2 The VAR for the fixed-rate securities issued by HSBC
Holdings is not included within the Group VAR. This is
disclosed separately on page 252.
3 Credit spread VAR is reported for the credit derivatives
transacted by Global Banking. This is disclosed on
page 251.
Value at risk
(Audited)
VAR is a technique that estimates the potential losses
that could occur on risk positions as a result of
movements in market rates and prices over a
specified time horizon and to a given level of
confidence.
The VAR models used by HSBC are
predominantly based on historical simulation. These
models derive plausible future scenarios from past
series of recorded market rates and prices, taking
account of inter-relationships between different
markets and rates such as interest rates and foreign
exchange rates. The models also incorporate the
effect of option features on the underlying
exposures.
The historical simulation models used by HSBC
incorporate the following features:
• potential market movements are calculated with
reference to data from the past two years;
• historical market rates and prices are calculated
with reference to foreign exchange rates and
commodity prices, interest rates, equity prices
and the associated volatilities;
• VAR is calculated to a 99 per cent confidence
level; and
• VAR is calculated for a one-day holding period.
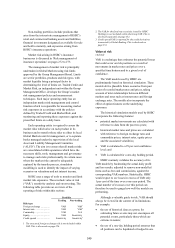
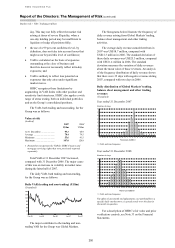
HSBC routinely validates the accuracy of its
VAR models by backtesting the actual daily profit
and loss results, adjusted to remove non-modelled
items such as fees and commissions, against the
corresponding VAR numbers. Statistically, HSBC
would expect to see losses in excess of VAR only
1 per cent of the time over a one-year period. The
actual number of excesses over this period can
therefore be used to gauge how well the models are
performing.
Although a valuable guide to risk, VAR should
always be viewed in the context of its limitations.
For example:
• the use of historical data as a proxy for
estimating future events may not encompass all
potential events, particularly those which are
extreme in nature;
• the use of a one-day holding period assumes that
all positions can be liquidated or hedged in one