HSBC 2007 Annual Report Download - page 155
Download and view the complete annual report
Please find page 155 of the 2007 HSBC annual report below. You can navigate through the pages in the report by either clicking on the pages listed below, or by using the keyword search tool below to find specific information within the annual report.-
 1
1 -
2
-
3
-
4
-
5
-
6
-
7
-
8
-
9
-
10
-
11
-
12
-
13
-
14
-
15
-
16
-
17
-
18
-
19
-
20
-
21
-
22
-
23
-
24
-
25
-
26
-
27
-
28
-
29
-
30
-
31
-
32
-
33
-
34
-
35
-
36
-
37
-
38
-
39
-
40
-
41
-
42
-
43
-
44
-
45
-
46
-
47
-
48
-
49
-
50
-
51
-
52
-
53
-
54
-
55
-
56
-
57
-
58
-
59
-
60
-
61
-
62
-
63
-
64
-
65
-
66
-
67
-
68
-
69
-
70
-
71
-
72
-
73
-
74
-
75
-
76
-
77
-
78
-
79
-
80
-
81
-
82
-
83
-
84
-
85
-
86
-
87
-
88
-
89
-
90
-
91
-
92
-
93
-
94
-
95
-
96
-
97
-
98
-
99
-
100
-
101
-
102
-
103
-
104
-
105
-
106
-
107
-
108
-
109
-
110
-
111
-
112
-
113
-
114
-
115
-
116
-
117
-
118
-
119
-
120
-
121
-
122
-
123
-
124
-
125
-
126
-
127
-
128
-
129
-
130
-
131
-
132
-
133
-
134
-
135
-
136
-
137
-
138
-
139
-
140
-
141
-
142
-
143
-
144
-
 145
145 -
 146
146 -
 147
147 -
 148
148 -
 149
149 -
 150
150 -
 151
151 -
 152
152 -
 153
153 -
 154
154 -
 155
155 -
 156
156 -
 157
157 -
 158
158 -
 159
159 -
 160
160 -
 161
161 -
 162
162 -
 163
163 -
 164
164 -
 165
165 -
166
-
167
-
168
-
169
-
170
-
171
-
172
-
173
-
174
-
175
-
176
-
177
-
178
-
179
-
180
-
181
-
182
-
183
-
184
-
185
-
186
-
187
-
188
-
189
-
190
-
191
-
192
-
193
-
194
-
195
-
196
-
197
-
198
-
199
-
200
-
201
-
202
-
203
-
204
-
205
-
206
-
207
-
208
-
209
-
210
-
211
-
212
-
213
-
214
-
215
-
216
-
217
-
218
-
219
-
220
-
221
-
222
-
223
-
224
-
225
-
226
-
227
-
228
-
229
-
230
-
231
-
232
-
233
-
234
-
235
-
236
-
237
-
238
-
239
-
240
-
241
-
242
-
243
-
244
-
245
-
246
-
247
-
248
-
249
-
250
-
251
-
252
-
253
-
254
-
255
-
256
-
257
-
258
-
259
-
260
-
261
-
262
-
263
-
264
-
265
-
266
-
267
-
268
-
269
-
270
-
271
-
272
-
273
-
274
-
275
-
276
-
277
-
278
-
279
-
280
-
281
-
282
-
283
-
284
-
285
-
286
-
287
-
288
-
289
-
290
-
291
-
292
-
293
-
294
-
295
-
296
-
297
-
298
-
299
-
300
-
301
-
302
-
303
-
304
-
305
-
306
-
307
-
308
-
309
-
310
-
311
-
312
-
313
-
314
-
315
-
316
-
317
-
318
-
319
-
320
-
321
-
322
-
323
-
324
-
325
-
326
-
327
-
328
-
329
-
330
-
331
-
332
-
333
-
334
-
335
-
336
-
337
-
338
-
339
-
340
-
341
-
342
-
343
-
344
-
345
-
346
-
347
-
348
-
349
-
350
-
351
-
352
-
353
-
354
-
355
-
356
-
357
-
358
-
359
-
360
-
361
-
362
-
363
-
364
-
365
-
366
-
367
-
368
-
369
-
370
-
371
-
372
-
373
-
374
-
375
-
376
-
377
-
378
-
379
-
380
-
381
-
382
-
383
-
384
-
385
-
386
-
387
-
388
-
389
-
390
-
391
-
392
-
393
-
394
-
395
-
396
-
397
-
398
-
399
-
400
-
401
-
402
-
403
-
404
-
405
-
406
-
407
-
408
-
409
-
410
-
411
-
412
-
413
-
414
-
415
-
416
-
417
-
418
-
419
-
420
-
421
-
422
-
423
-
424
-
425
-
426
-
427
-
428
-
429
-
430
-
431
-
432
-
433
-
434
-
435
-
436
-
437
-
438
-
439
-
440
-
441
-
442
-
443
-
444
-
445
-
446
-
447
-
448
-
449
-
450
-
451
-
452
-
453
-
454
-
455
-
456
-
457
-
458
-
459
-
460
-
461
-
462
-
463
-
464
-
465
-
466
-
467
-
468
-
469
-
470
-
471
-
472
-
473
-
474
-
475
-
476
 |
 |

153
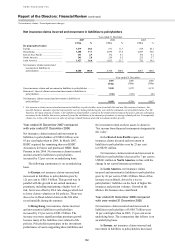
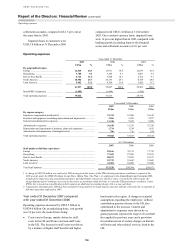
by 35 per cent to US$531 million, primarily driven
by lower sales of critical illness and creditor
protection products, along with the effect of adverse
movements in fixed interest rate markets on the
value of liabilities to policyholders.
Net insurance claims and movement in
liabilities to policyholders in Hong Kong increased
by 31 per cent, predominantly in the life insurance
business, in which reserves for liabilities to
policyholders rose with business growth, together
with the rising value of investments. Growth in the
underwriting of accident and health business resulted
in higher non-life insurance claims reserves.
Net insurance claims and movement in
liabilities to policyholders in North America rose
by 12 per cent to US$259 million, mainly reflecting
an increase in reserves for new life insurance
business underwritten in 2006.
In Latin America, higher sales of life and
pension fund products led to an increase in net
insurance claims incurred and movement in
liabilities to policyholders of 24 per cent to
US$1,023 million. Lower movements in the non-life
insurance liabilities were due to the sale of the non-
life insurance business, HSBC Seguros, in Brazil
during the latter half of 2005.
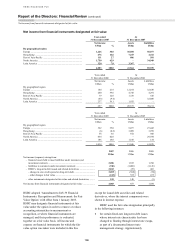
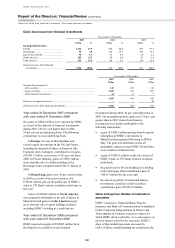
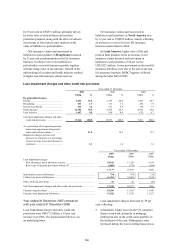
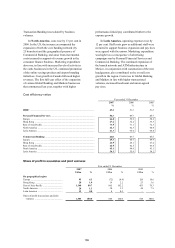
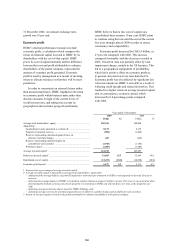
Loan impairment charges and other credit risk provisions
Year ended 31 December
2007 2006 2005
US$m % US$m % US$m %
By geographical region
Europe ...................................................... 2,542 14.8 2,155 20.4 1,929 24.7
Hong Kong .............................................. 231 1.3 172 1.6 146 1.9
Rest of Asia-Pacific ................................. 616 3.6 512 4.8 134 1.7
North America ......................................... 12,156 70.5 6,796 64.3 4,916 63.0
Latin America .......................................... 1,697 9.8 938 8.9 676 8.7
Total loan impairment charges and other
credit risk provisions ........................... 17,242 100.0 10,573 100.0 7,801
100.0
As a percentage of net operating income
before loan impairment charges and
other credit risk provisions .................. 21.8
16.2
13.5
Impairment charges on loans and
advances to customers as a percentage
of gross average loans and advances to
customers ............................................. 2.1
1.4
1.2
Year ended 31 December
2007
US$m
2006
US$m
2005
US$m
Loan impairment charges
New allowances net of allowance releases ................................................. 18,182 11,326 8,354
Recoveries of amounts previously written off ............................................ (1,005) (779) (494)
17,177 10,547 7,860
Individually assessed allowances .................................................................... 796 458 518
Collectively assessed allowances .................................................................... 16,381 10,089 7,342
Other credit risk provisions ............................................................................. 65 26 (59)
Total loan impairment charges and other credit risk provisions ..................... 17,242 10,573 7,801
Customer impaired loans ................................................................................. 18,304 13,785 11,446
Customer loan impairment allowances ........................................................... 19,205 13,578 11,357
Year ended 31 December 2007 compared
with year ended 31 December 2006
Loan impairment charges and other credit risk
provisions were US$17.2 billion, a 63 per cent
increase over 2006. The analysis that follows is on
an underlying basis.
Loan impairment charges increased by 58 per
cent, reflecting:
• substantially higher losses in the US consumer
finance loan book, primarily in mortgage
lending but also in the credit cards portfolio in
the final part of the year. Delinquency rates
increased during the year as falling house prices