HSBC 2007 Annual Report Download - page 226
Download and view the complete annual report
Please find page 226 of the 2007 HSBC annual report below. You can navigate through the pages in the report by either clicking on the pages listed below, or by using the keyword search tool below to find specific information within the annual report.-
 1
1 -
2
-
3
-
4
-
5
-
6
-
7
-
8
-
9
-
10
-
11
-
12
-
13
-
14
-
15
-
16
-
17
-
18
-
19
-
20
-
21
-
22
-
23
-
24
-
25
-
26
-
27
-
28
-
29
-
30
-
31
-
32
-
33
-
34
-
35
-
36
-
37
-
38
-
39
-
40
-
41
-
42
-
43
-
44
-
45
-
46
-
47
-
48
-
49
-
50
-
51
-
52
-
53
-
54
-
55
-
56
-
57
-
58
-
59
-
60
-
61
-
62
-
63
-
64
-
65
-
66
-
67
-
68
-
69
-
70
-
71
-
72
-
73
-
74
-
75
-
76
-
77
-
78
-
79
-
80
-
81
-
82
-
83
-
84
-
85
-
86
-
87
-
88
-
89
-
90
-
91
-
92
-
93
-
94
-
95
-
96
-
97
-
98
-
99
-
100
-
101
-
102
-
103
-
104
-
105
-
106
-
107
-
108
-
109
-
110
-
111
-
112
-
113
-
114
-
115
-
116
-
117
-
118
-
119
-
120
-
121
-
122
-
123
-
124
-
125
-
126
-
127
-
128
-
129
-
130
-
131
-
132
-
133
-
134
-
135
-
136
-
137
-
138
-
139
-
140
-
141
-
142
-
143
-
144
-
145
-
146
-
147
-
148
-
149
-
150
-
151
-
152
-
153
-
154
-
155
-
156
-
157
-
158
-
159
-
160
-
161
-
162
-
163
-
164
-
165
-
166
-
167
-
168
-
169
-
170
-
171
-
172
-
173
-
174
-
175
-
176
-
177
-
178
-
179
-
180
-
181
-
182
-
183
-
184
-
185
-
186
-
187
-
188
-
189
-
190
-
191
-
192
-
193
-
194
-
195
-
196
-
197
-
198
-
199
-
200
-
201
-
202
-
203
-
204
-
205
-
206
-
207
-
208
-
209
-
210
-
211
-
212
-
213
-
214
-
215
-
 216
216 -
 217
217 -
 218
218 -
 219
219 -
 220
220 -
 221
221 -
 222
222 -
 223
223 -
 224
224 -
 225
225 -
 226
226 -
 227
227 -
 228
228 -
 229
229 -
 230
230 -
 231
231 -
 232
232 -
 233
233 -
 234
234 -
 235
235 -
 236
236 -
237
-
238
-
239
-
240
-
241
-
242
-
243
-
244
-
245
-
246
-
247
-
248
-
249
-
250
-
251
-
252
-
253
-
254
-
255
-
256
-
257
-
258
-
259
-
260
-
261
-
262
-
263
-
264
-
265
-
266
-
267
-
268
-
269
-
270
-
271
-
272
-
273
-
274
-
275
-
276
-
277
-
278
-
279
-
280
-
281
-
282
-
283
-
284
-
285
-
286
-
287
-
288
-
289
-
290
-
291
-
292
-
293
-
294
-
295
-
296
-
297
-
298
-
299
-
300
-
301
-
302
-
303
-
304
-
305
-
306
-
307
-
308
-
309
-
310
-
311
-
312
-
313
-
314
-
315
-
316
-
317
-
318
-
319
-
320
-
321
-
322
-
323
-
324
-
325
-
326
-
327
-
328
-
329
-
330
-
331
-
332
-
333
-
334
-
335
-
336
-
337
-
338
-
339
-
340
-
341
-
342
-
343
-
344
-
345
-
346
-
347
-
348
-
349
-
350
-
351
-
352
-
353
-
354
-
355
-
356
-
357
-
358
-
359
-
360
-
361
-
362
-
363
-
364
-
365
-
366
-
367
-
368
-
369
-
370
-
371
-
372
-
373
-
374
-
375
-
376
-
377
-
378
-
379
-
380
-
381
-
382
-
383
-
384
-
385
-
386
-
387
-
388
-
389
-
390
-
391
-
392
-
393
-
394
-
395
-
396
-
397
-
398
-
399
-
400
-
401
-
402
-
403
-
404
-
405
-
406
-
407
-
408
-
409
-
410
-
411
-
412
-
413
-
414
-
415
-
416
-
417
-
418
-
419
-
420
-
421
-
422
-
423
-
424
-
425
-
426
-
427
-
428
-
429
-
430
-
431
-
432
-
433
-
434
-
435
-
436
-
437
-
438
-
439
-
440
-
441
-
442
-
443
-
444
-
445
-
446
-
447
-
448
-
449
-
450
-
451
-
452
-
453
-
454
-
455
-
456
-
457
-
458
-
459
-
460
-
461
-
462
-
463
-
464
-
465
-
466
-
467
-
468
-
469
-
470
-
471
-
472
-
473
-
474
-
475
-
476
 |
 |

HSBC HOLDINGS PLC
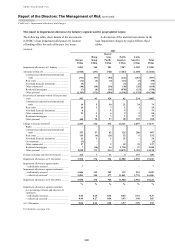
Report of the Directors: The Management of Risk (continued)
Credit risk > Credit quality > Loans and advances
224
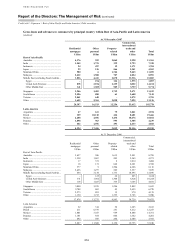
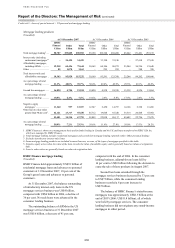
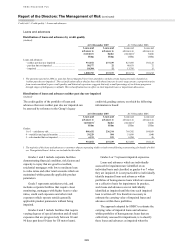
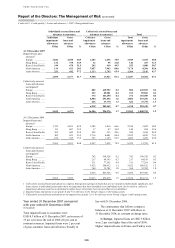
Loans and advances
Distribution of loans and advances by credit quality
(Audited)
At 31 December 2007 At 31 December 2006
Loans and
advances to
customers
Loans and
advances to
banks
Loans and
advances to
customers1
Loans and
advances to
banks
US$m US$m US$m US$m
Loans and advances:
– neither past due nor impaired ................................ 931,872 237,339 827,495 185,125
– past due but not impaired ...................................... 50,577 22 40,431 72
– impaired ................................................................. 18,304 12 13,785 15
1,000,753 237,373 881,711 185,212
1 The amounts reported in 2006 as ‘past due but not impaired’ have been amended to include certain loans previously classified as
‘neither past due nor impaired’. The reclassification reflects the fact that, while these loans are in early-stage arrears, a proportion arise
from events unrelated to poor credit quality, and historical experience suggests that only a small percentage of such loans progresses
through stages of delinquency to default. This reclassification has no effect on total impaired loans or impairment allowances.
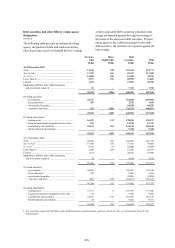
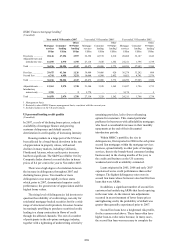
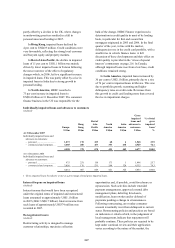
Distribution of loans and advances neither past due nor impaired
(Audited)
The credit quality of the portfolio of loans and
advances that were neither past due nor impaired can
be assessed by reference to the Group’s legacy
credit risk grading system, on which the following
information is based:
At 31 December 2007 At 31 December 2006
Loans and
advances to
customers1
Loans and
advances to
banks
Loans and
advances to
customers1
Loans and
advances to
banks
US$m US$m US$m US$m
Grades:
1 to 3 – satisfactory risk ........................................... 886,432 236,314 769,392 184,059
4 – watch list and special mention ........................... 39,229 504 51,899 1,040
5 – sub-standard but not impaired ............................ 6,211 521 6,204 26
931,872 237,339 827,495 185,125
1 The majority of the loans and advances to customers that are operating within revised terms following restructuring, for details of which
see ‘Renegotiated loans’ below, are included in this table.
Grades 1 and 2 include corporate facilities
demonstrating financial condition, risk factors and
capacity to repay that are good to excellent,
residential mortgages with low to moderate loan
to value ratios and other retail accounts which are
maintained within generally applicable product
parameters.
Grade 3 represents satisfactory risk, and
includes corporate facilities that require closer
monitoring, mortgages with higher loan to value
ratios, credit card exposures and other retail
exposures which operate outside generally
applicable product parameters without being
impaired.
Grades 4 and 5 include facilities that require
varying degrees of special attention and all retail
exposures that are progressively between 30 and
90 days past due (60 days for US motor loans).
Grades 6 or 7 represent impaired exposures.
Loans and advances which are individually
assessed for impairment are identified on an
individual basis and classified as grades 6 or 7 when
they are impaired. It is not practicable to individually
identify impaired loans and advances within
portfolios of homogeneous loans which are assessed
on a collective basis for impairment. In practice,
such loans and advances are not individually
identified as impaired until the time each impaired
loan is written off. It is therefore necessary to
estimate the carrying value of impaired loans and
advances within these portfolios.
The approach adopted by HSBC to estimate the
carrying value of impaired loans and advances
within portfolios of homogeneous loans that are
collectively assessed for impairment, is to classify
these loans and advances as impaired when the