HSBC 2007 Annual Report Download - page 232
Download and view the complete annual report
Please find page 232 of the 2007 HSBC annual report below. You can navigate through the pages in the report by either clicking on the pages listed below, or by using the keyword search tool below to find specific information within the annual report.-
 1
1 -
2
-
3
-
4
-
5
-
6
-
7
-
8
-
9
-
10
-
11
-
12
-
13
-
14
-
15
-
16
-
17
-
18
-
19
-
20
-
21
-
22
-
23
-
24
-
25
-
26
-
27
-
28
-
29
-
30
-
31
-
32
-
33
-
34
-
35
-
36
-
37
-
38
-
39
-
40
-
41
-
42
-
43
-
44
-
45
-
46
-
47
-
48
-
49
-
50
-
51
-
52
-
53
-
54
-
55
-
56
-
57
-
58
-
59
-
60
-
61
-
62
-
63
-
64
-
65
-
66
-
67
-
68
-
69
-
70
-
71
-
72
-
73
-
74
-
75
-
76
-
77
-
78
-
79
-
80
-
81
-
82
-
83
-
84
-
85
-
86
-
87
-
88
-
89
-
90
-
91
-
92
-
93
-
94
-
95
-
96
-
97
-
98
-
99
-
100
-
101
-
102
-
103
-
104
-
105
-
106
-
107
-
108
-
109
-
110
-
111
-
112
-
113
-
114
-
115
-
116
-
117
-
118
-
119
-
120
-
121
-
122
-
123
-
124
-
125
-
126
-
127
-
128
-
129
-
130
-
131
-
132
-
133
-
134
-
135
-
136
-
137
-
138
-
139
-
140
-
141
-
142
-
143
-
144
-
145
-
146
-
147
-
148
-
149
-
150
-
151
-
152
-
153
-
154
-
155
-
156
-
157
-
158
-
159
-
160
-
161
-
162
-
163
-
164
-
165
-
166
-
167
-
168
-
169
-
170
-
171
-
172
-
173
-
174
-
175
-
176
-
177
-
178
-
179
-
180
-
181
-
182
-
183
-
184
-
185
-
186
-
187
-
188
-
189
-
190
-
191
-
192
-
193
-
194
-
195
-
196
-
197
-
198
-
199
-
200
-
201
-
202
-
203
-
204
-
205
-
206
-
207
-
208
-
209
-
210
-
211
-
212
-
213
-
214
-
215
-
216
-
217
-
218
-
219
-
220
-
221
-
 222
222 -
 223
223 -
 224
224 -
 225
225 -
 226
226 -
 227
227 -
 228
228 -
 229
229 -
 230
230 -
 231
231 -
 232
232 -
 233
233 -
 234
234 -
 235
235 -
 236
236 -
 237
237 -
 238
238 -
 239
239 -
 240
240 -
 241
241 -
 242
242 -
243
-
244
-
245
-
246
-
247
-
248
-
249
-
250
-
251
-
252
-
253
-
254
-
255
-
256
-
257
-
258
-
259
-
260
-
261
-
262
-
263
-
264
-
265
-
266
-
267
-
268
-
269
-
270
-
271
-
272
-
273
-
274
-
275
-
276
-
277
-
278
-
279
-
280
-
281
-
282
-
283
-
284
-
285
-
286
-
287
-
288
-
289
-
290
-
291
-
292
-
293
-
294
-
295
-
296
-
297
-
298
-
299
-
300
-
301
-
302
-
303
-
304
-
305
-
306
-
307
-
308
-
309
-
310
-
311
-
312
-
313
-
314
-
315
-
316
-
317
-
318
-
319
-
320
-
321
-
322
-
323
-
324
-
325
-
326
-
327
-
328
-
329
-
330
-
331
-
332
-
333
-
334
-
335
-
336
-
337
-
338
-
339
-
340
-
341
-
342
-
343
-
344
-
345
-
346
-
347
-
348
-
349
-
350
-
351
-
352
-
353
-
354
-
355
-
356
-
357
-
358
-
359
-
360
-
361
-
362
-
363
-
364
-
365
-
366
-
367
-
368
-
369
-
370
-
371
-
372
-
373
-
374
-
375
-
376
-
377
-
378
-
379
-
380
-
381
-
382
-
383
-
384
-
385
-
386
-
387
-
388
-
389
-
390
-
391
-
392
-
393
-
394
-
395
-
396
-
397
-
398
-
399
-
400
-
401
-
402
-
403
-
404
-
405
-
406
-
407
-
408
-
409
-
410
-
411
-
412
-
413
-
414
-
415
-
416
-
417
-
418
-
419
-
420
-
421
-
422
-
423
-
424
-
425
-
426
-
427
-
428
-
429
-
430
-
431
-
432
-
433
-
434
-
435
-
436
-
437
-
438
-
439
-
440
-
441
-
442
-
443
-
444
-
445
-
446
-
447
-
448
-
449
-
450
-
451
-
452
-
453
-
454
-
455
-
456
-
457
-
458
-
459
-
460
-
461
-
462
-
463
-
464
-
465
-
466
-
467
-
468
-
469
-
470
-
471
-
472
-
473
-
474
-
475
-
476
 |
 |
HSBC HOLDINGS PLC
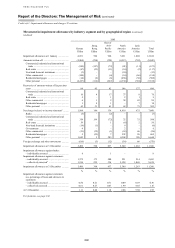
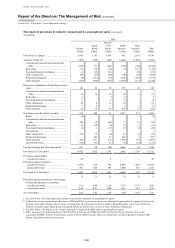
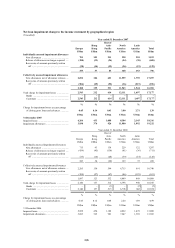
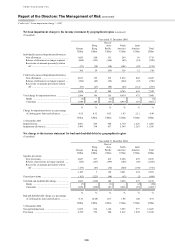
Report of the Directors: The Management of Risk (continued)
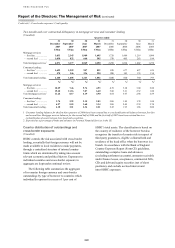
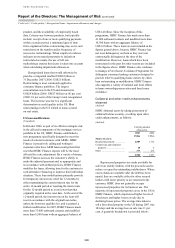
Credit risk > Impairment allowances and charges
230
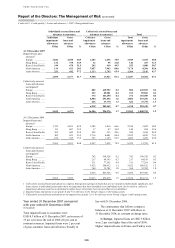
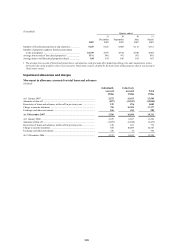
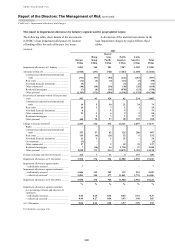
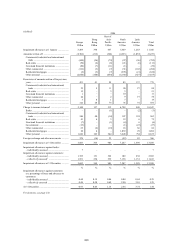
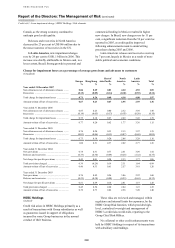
Movement in impairment allowances by industry segment and by geographical region
The following tables show details of the movements
in HSBC’s loan impairment allowances by location
of lending office for each of the past five years.
A discussion of the material movements in the
loan impairment charges by region follows these
tables.
(Audited) 2007
Europe
Hong
Kong
Rest of
Asia-
Pacific
North
America
Latin
America
Total
US$m US$m US$m US$m US$m US$m
Impairment allowances at 1 January .................. 3,683 365 901 7,247 1,389 13,585
Amounts written off ........................................... (2,940) (251) (724) (7,444) (1,485) (12,844)
Commercial, industrial and international
trade ............................................................ (371) (57) (94) (122) (253) (897)
Real estate ....................................................... (72) (4) (5) (14) (3) (98)
Non-bank financial institutions ...................... (5) – – (5) (1) (11)
Other commercial ........................................... (90) (10) (10) (30) (28) (168)
Residential mortgages .................................... (7) (8) (16) (878) (21) (930)
Other personal ................................................ (2,395) (172) (599) (6,395) (1,179) (10,740)
Recoveries of amounts written off in previous
years ................................................................ 542 43 124 62 234 1,005
Commercial, industrial and international
trade ............................................................ 14 5 10 21 24 74
Real estate ....................................................... 19 1 7 1 1 29
Non-bank financial institutions ...................... 8– 1 2 – 11
Other commercial ........................................... 33 1 6 9 5 54
Residential mortgages .................................... – 6 3 1 9 19
Other personal ................................................ 468 30 97 28 195 818
Charge to income statement1 .............................. 2,543 212 614 12,111 1,697 17,177
Banks .............................................................. – – – – – –
Commercial, industrial and international
trade ............................................................ 353 57 82 125 280 897
Real estate ....................................................... 119 (4) (21) 52 6 152
Non-bank financial institutions ...................... 12 2 1 21 – 36
Governments .................................................. (3) – – – – (3)
Other commercial ........................................... 27 – 2 59 39 127
Residential mortgages .................................... 7 (14) 16 1,784 47 1,840
Other personal ................................................ 2,028 171 534 10,070 1,325 14,128
Foreign exchange and other movements ............ 110 7 11 4 157 289
Impairment allowances at 31 December ............ 3,938 376 926 11,980 1,992 19,212
Impairment allowances against banks:
– individually assessed ................................... 7 – – – – 7
Impairment allowances against customers:
– individually assessed ................................... 1,846 132 349 119 253 2,699
– collectively assessed2 .................................. 2,085 244 577 11,861 1,739 16,506
Impairment allowances at 31 December ............ 3,938 376 926 11,980 1,992 19,212
% % % % % %
Impairment allowances against customers
as a percentage of loans and advances to
customers:
– individually assessed ................................... 0.40 0.15 0.34 0.04 0.51 0.27
– collectively assessed .................................... 0.46 0.27 0.56 3.93 3.48 1.65
At 31 December .................................................. 0.86 0.42 0.90 3.97 3.99 1.92
For footnotes, see page 234.