HSBC 2007 Annual Report Download - page 76
Download and view the complete annual report
Please find page 76 of the 2007 HSBC annual report below. You can navigate through the pages in the report by either clicking on the pages listed below, or by using the keyword search tool below to find specific information within the annual report.-
 1
1 -
2
-
3
-
4
-
5
-
6
-
7
-
8
-
9
-
10
-
11
-
12
-
13
-
14
-
15
-
16
-
17
-
18
-
19
-
20
-
21
-
22
-
23
-
24
-
25
-
26
-
27
-
28
-
29
-
30
-
31
-
32
-
33
-
34
-
35
-
36
-
37
-
38
-
39
-
40
-
41
-
42
-
43
-
44
-
45
-
46
-
47
-
48
-
49
-
50
-
51
-
52
-
53
-
54
-
55
-
56
-
57
-
58
-
59
-
60
-
61
-
62
-
63
-
64
-
65
-
 66
66 -
 67
67 -
 68
68 -
 69
69 -
 70
70 -
 71
71 -
 72
72 -
 73
73 -
 74
74 -
 75
75 -
 76
76 -
 77
77 -
 78
78 -
 79
79 -
 80
80 -
 81
81 -
 82
82 -
 83
83 -
 84
84 -
 85
85 -
 86
86 -
87
-
88
-
89
-
90
-
91
-
92
-
93
-
94
-
95
-
96
-
97
-
98
-
99
-
100
-
101
-
102
-
103
-
104
-
105
-
106
-
107
-
108
-
109
-
110
-
111
-
112
-
113
-
114
-
115
-
116
-
117
-
118
-
119
-
120
-
121
-
122
-
123
-
124
-
125
-
126
-
127
-
128
-
129
-
130
-
131
-
132
-
133
-
134
-
135
-
136
-
137
-
138
-
139
-
140
-
141
-
142
-
143
-
144
-
145
-
146
-
147
-
148
-
149
-
150
-
151
-
152
-
153
-
154
-
155
-
156
-
157
-
158
-
159
-
160
-
161
-
162
-
163
-
164
-
165
-
166
-
167
-
168
-
169
-
170
-
171
-
172
-
173
-
174
-
175
-
176
-
177
-
178
-
179
-
180
-
181
-
182
-
183
-
184
-
185
-
186
-
187
-
188
-
189
-
190
-
191
-
192
-
193
-
194
-
195
-
196
-
197
-
198
-
199
-
200
-
201
-
202
-
203
-
204
-
205
-
206
-
207
-
208
-
209
-
210
-
211
-
212
-
213
-
214
-
215
-
216
-
217
-
218
-
219
-
220
-
221
-
222
-
223
-
224
-
225
-
226
-
227
-
228
-
229
-
230
-
231
-
232
-
233
-
234
-
235
-
236
-
237
-
238
-
239
-
240
-
241
-
242
-
243
-
244
-
245
-
246
-
247
-
248
-
249
-
250
-
251
-
252
-
253
-
254
-
255
-
256
-
257
-
258
-
259
-
260
-
261
-
262
-
263
-
264
-
265
-
266
-
267
-
268
-
269
-
270
-
271
-
272
-
273
-
274
-
275
-
276
-
277
-
278
-
279
-
280
-
281
-
282
-
283
-
284
-
285
-
286
-
287
-
288
-
289
-
290
-
291
-
292
-
293
-
294
-
295
-
296
-
297
-
298
-
299
-
300
-
301
-
302
-
303
-
304
-
305
-
306
-
307
-
308
-
309
-
310
-
311
-
312
-
313
-
314
-
315
-
316
-
317
-
318
-
319
-
320
-
321
-
322
-
323
-
324
-
325
-
326
-
327
-
328
-
329
-
330
-
331
-
332
-
333
-
334
-
335
-
336
-
337
-
338
-
339
-
340
-
341
-
342
-
343
-
344
-
345
-
346
-
347
-
348
-
349
-
350
-
351
-
352
-
353
-
354
-
355
-
356
-
357
-
358
-
359
-
360
-
361
-
362
-
363
-
364
-
365
-
366
-
367
-
368
-
369
-
370
-
371
-
372
-
373
-
374
-
375
-
376
-
377
-
378
-
379
-
380
-
381
-
382
-
383
-
384
-
385
-
386
-
387
-
388
-
389
-
390
-
391
-
392
-
393
-
394
-
395
-
396
-
397
-
398
-
399
-
400
-
401
-
402
-
403
-
404
-
405
-
406
-
407
-
408
-
409
-
410
-
411
-
412
-
413
-
414
-
415
-
416
-
417
-
418
-
419
-
420
-
421
-
422
-
423
-
424
-
425
-
426
-
427
-
428
-
429
-
430
-
431
-
432
-
433
-
434
-
435
-
436
-
437
-
438
-
439
-
440
-
441
-
442
-
443
-
444
-
445
-
446
-
447
-
448
-
449
-
450
-
451
-
452
-
453
-
454
-
455
-
456
-
457
-
458
-
459
-
460
-
461
-
462
-
463
-
464
-
465
-
466
-
467
-
468
-
469
-
470
-
471
-
472
-
473
-
474
-
475
-
476
 |
 |

HSBC HOLDINGS PLC
Report of the Directors: Business Review (continued)
Rest of Asia-Pacific > 2007
74
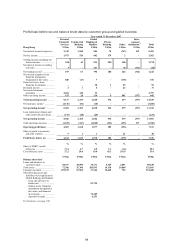
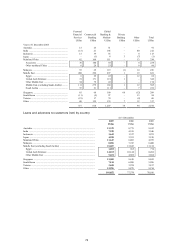
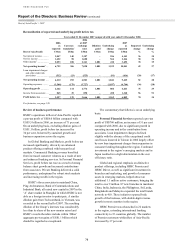
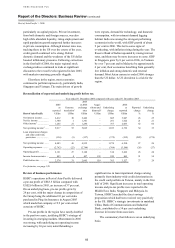
Customer accounts by country
At 31 December
2007
US$m
2006
US$m
2005
US$m
Australia ........................................................................................................... 11,418 8,491 7,458
India ................................................................................................................. 12,021 7,936 5,146
Indonesia .......................................................................................................... 2,574 2,082 1,826
Japan ................................................................................................................ 4,657 4,186 5,892
Mainland China ............................................................................................... 14,537 6,941 4,826
Malaysia ........................................................................................................... 11,701 9,640 7,795
Middle East (excluding Saudi Arabia) ............................................................ 30,937 21,196 15,658
Egypt ........................................................................................................... 4,056 2,703 1,992
United Arab Emirates .................................................................................. 18,455 11,166 8,761
Other Middle East ....................................................................................... 8,426 7,327 4,905
Singapore ......................................................................................................... 28,962 23,517 19,562
South Korea ..................................................................................................... 5,760 3,890 3,554
Taiwan ............................................................................................................. 9,426 7,675 5,718
Other ................................................................................................................ 18,240 13,441 11,683
150,233 108,995 89,118
Year ended 31 December 2007 compared
with year ended 31 December 2006
Economic briefing
Mainland China’s economy continued to grow
strongly, with GDP rising by 11.4 per cent in 2007,
the fifth consecutive year of double-digit growth;
this was despite a combination of measures aimed at
curbing investment, such as increases in interest
rates and reserve ratios required for banks. Economic
performance remained primarily dependent on
investment and exports. Bank loan growth also
remained very strong. Export growth slowed from
very high levels as the year progressed, reflecting the
mild downturn in global trade. Consumer spending
grew steadily in 2007, with retail sales rising by
about 16 per cent. Inflationary pressures increased,
with consumer price inflation exceeding 6 per cent
towards the end of the year, mainly due to higher
food prices. Mainland China’s foreign exchange
reserves rose further, to more than US$1.5 trillion,
while the renminbi appreciated by over 5 per cent
against the US dollar in 2007.
Japan’s economy, the largest in the region,
expanded modestly in 2007. Private capital
investment decelerated after five years of firm
growth but a rise in exports, especially to Asia,
drove overall growth. Private consumption also
made a positive contribution, helped by a gradual
increase in employees’ income. Core consumer price
inflation remained around zero throughout the course
of the year.
In the Middle East, economies continued to
grow, although growth rates slowed slightly on those
recorded in 2006, largely as a result of OPEC-
mandated cuts in oil production. Underlying
economic performance was robust, however, led by
continued non-oil sector growth. The catalyst for
expansion was a fifth consecutive year of rising oil
prices, which facilitated continued growth in public
and private investment. Consumption rose as
employment levels increased and low interest rates
supported an ongoing expansion in credit. Strong
population growth, accelerated in parts of the region
by high levels of immigration, also boosted demand
for credit. High oil revenues resulted in a further
year of fiscal and current account surpluses
throughout the Middle East, boosting reserves and
holdings of overseas assets. Rapid economic growth,
low interest rates and currency weakness increased
inflation, however, fuelling demands in some
quarters for adjustments to the long-standing dollar
pegs. Regional equity markets recovered from their
2005-06 downturns to perform strongly in 2007.
Elsewhere in the region, the Indian economy
expanded by 8.7 per cent in 2007, although there
was evidence that recent interest rate rises and the
strength of the rupee were slowing some areas of the
economy, and inflationary pressures eased in 2007.
The economies of Vietnam and Singapore recorded
strong performances too, expanding by 8.5 per cent
and 7.7 per cent, respectively in 2007. Growth was
approximately 6 per cent in Indonesia and Malaysia.
Domestic demand in all these countries has become
an increasingly important source of GDP growth
with investment, particularly in the construction
sector, expanding rapidly. Inflationary pressures
intensified in 2007, largely as a result of higher oil
and food prices, but remained under control. The
South Korean economy accelerated in 2007 as
exports continued to flourish and household
spending recovered from levels recorded in 2006.