HSBC 2007 Annual Report Download - page 140
Download and view the complete annual report
Please find page 140 of the 2007 HSBC annual report below. You can navigate through the pages in the report by either clicking on the pages listed below, or by using the keyword search tool below to find specific information within the annual report.-
 1
1 -
2
-
3
-
4
-
5
-
6
-
7
-
8
-
9
-
10
-
11
-
12
-
13
-
14
-
15
-
16
-
17
-
18
-
19
-
20
-
21
-
22
-
23
-
24
-
25
-
26
-
27
-
28
-
29
-
30
-
31
-
32
-
33
-
34
-
35
-
36
-
37
-
38
-
39
-
40
-
41
-
42
-
43
-
44
-
45
-
46
-
47
-
48
-
49
-
50
-
51
-
52
-
53
-
54
-
55
-
56
-
57
-
58
-
59
-
60
-
61
-
62
-
63
-
64
-
65
-
66
-
67
-
68
-
69
-
70
-
71
-
72
-
73
-
74
-
75
-
76
-
77
-
78
-
79
-
80
-
81
-
82
-
83
-
84
-
85
-
86
-
87
-
88
-
89
-
90
-
91
-
92
-
93
-
94
-
95
-
96
-
97
-
98
-
99
-
100
-
101
-
102
-
103
-
104
-
105
-
106
-
107
-
108
-
109
-
110
-
111
-
112
-
113
-
114
-
115
-
116
-
117
-
118
-
119
-
120
-
121
-
122
-
123
-
124
-
125
-
126
-
127
-
128
-
129
-
 130
130 -
 131
131 -
 132
132 -
 133
133 -
 134
134 -
 135
135 -
 136
136 -
 137
137 -
 138
138 -
 139
139 -
 140
140 -
 141
141 -
 142
142 -
 143
143 -
 144
144 -
 145
145 -
 146
146 -
 147
147 -
 148
148 -
 149
149 -
 150
150 -
151
-
152
-
153
-
154
-
155
-
156
-
157
-
158
-
159
-
160
-
161
-
162
-
163
-
164
-
165
-
166
-
167
-
168
-
169
-
170
-
171
-
172
-
173
-
174
-
175
-
176
-
177
-
178
-
179
-
180
-
181
-
182
-
183
-
184
-
185
-
186
-
187
-
188
-
189
-
190
-
191
-
192
-
193
-
194
-
195
-
196
-
197
-
198
-
199
-
200
-
201
-
202
-
203
-
204
-
205
-
206
-
207
-
208
-
209
-
210
-
211
-
212
-
213
-
214
-
215
-
216
-
217
-
218
-
219
-
220
-
221
-
222
-
223
-
224
-
225
-
226
-
227
-
228
-
229
-
230
-
231
-
232
-
233
-
234
-
235
-
236
-
237
-
238
-
239
-
240
-
241
-
242
-
243
-
244
-
245
-
246
-
247
-
248
-
249
-
250
-
251
-
252
-
253
-
254
-
255
-
256
-
257
-
258
-
259
-
260
-
261
-
262
-
263
-
264
-
265
-
266
-
267
-
268
-
269
-
270
-
271
-
272
-
273
-
274
-
275
-
276
-
277
-
278
-
279
-
280
-
281
-
282
-
283
-
284
-
285
-
286
-
287
-
288
-
289
-
290
-
291
-
292
-
293
-
294
-
295
-
296
-
297
-
298
-
299
-
300
-
301
-
302
-
303
-
304
-
305
-
306
-
307
-
308
-
309
-
310
-
311
-
312
-
313
-
314
-
315
-
316
-
317
-
318
-
319
-
320
-
321
-
322
-
323
-
324
-
325
-
326
-
327
-
328
-
329
-
330
-
331
-
332
-
333
-
334
-
335
-
336
-
337
-
338
-
339
-
340
-
341
-
342
-
343
-
344
-
345
-
346
-
347
-
348
-
349
-
350
-
351
-
352
-
353
-
354
-
355
-
356
-
357
-
358
-
359
-
360
-
361
-
362
-
363
-
364
-
365
-
366
-
367
-
368
-
369
-
370
-
371
-
372
-
373
-
374
-
375
-
376
-
377
-
378
-
379
-
380
-
381
-
382
-
383
-
384
-
385
-
386
-
387
-
388
-
389
-
390
-
391
-
392
-
393
-
394
-
395
-
396
-
397
-
398
-
399
-
400
-
401
-
402
-
403
-
404
-
405
-
406
-
407
-
408
-
409
-
410
-
411
-
412
-
413
-
414
-
415
-
416
-
417
-
418
-
419
-
420
-
421
-
422
-
423
-
424
-
425
-
426
-
427
-
428
-
429
-
430
-
431
-
432
-
433
-
434
-
435
-
436
-
437
-
438
-
439
-
440
-
441
-
442
-
443
-
444
-
445
-
446
-
447
-
448
-
449
-
450
-
451
-
452
-
453
-
454
-
455
-
456
-
457
-
458
-
459
-
460
-
461
-
462
-
463
-
464
-
465
-
466
-
467
-
468
-
469
-
470
-
471
-
472
-
473
-
474
-
475
-
476
 |
 |

HSBC HOLDINGS PLC
Report of the Directors: Financial Review (continued)
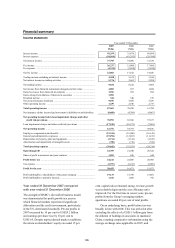
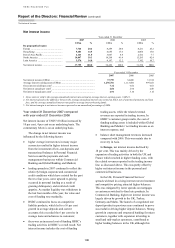
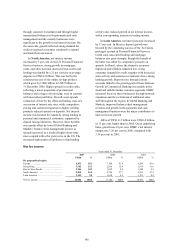
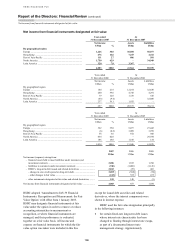
Net interest income
138
Net interest income
Year ended 31 December
2007 2006 2005
US$m % US$m % US$m %
By geographical region
Europe ...................................................... 7,746 20.4 8,289 24.0 8,221 26.2
Hong Kong .............................................. 5,483 14.5 4,685 13.6 4,064 13.0
Rest of Asia-Pacific ................................. 4,143 11.0 3,047 8.8 2,412 7.7
North America ......................................... 14,847 39.3 14,268 41.4 13,295 42.4
Latin America .......................................... 5,576 14.8 4,197 12.2 3,342 10.7
Net interest income .................................. 37,795 100.0 34,486 100.0 31,334 100.0
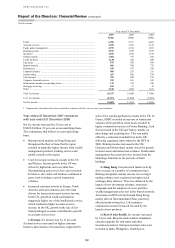
Year ended 31 December
2007 2006 2005
Net interest income (US$m)............................................................................. 37,795 34,486 31,334
Average interest-earning assets (US$m) .......................................................... 1,296,701 1,113,404 999,421
Gross interest yield (per cent)1 ......................................................................... 7.12 6.82 6.01
Net interest spread (per cent)2 .......................................................................... 2.86 2.94 2.88
Net interest margin (per cent)3 ......................................................................... 2.91 3.10 3.14
1 Gross interest yield is the average annualised interest rate earned on average interest-earning assets (‘AIEA’).
2 Net interest spread is the difference between the average annualised interest rate earned on AIEA, net of amortised premiums and loan
fees, and the average annualised interest rate paid on average interest-bearing funds.
3 Net interest margin is net interest income expressed as an annualised percentage of AIEA.
Year ended 31 December 2007 compared
with year ended 31 December 2006
Net interest income of US$37.8 billion increased by
10 per cent, 4 per cent on an underlying basis. The
commentary below is on an underlying basis.
The change in net interest income was
influenced by the following factors:
• higher average interest rates in many major
currencies resulted in higher interest income
from the investment of low-cost deposits and
transactional balances in Personal Financial
Services and the payments and cash
management businesses within Commercial
Banking and Global Banking and Markets;
• lending spreads in 2007 continued to reflect the
relatively benign corporate and commercial
credit conditions which have existed for the past
three to four years, some upward re-pricing
occurred in personal lending as a result of
growing delinquency and restricted credit
appetite. As market liquidity was withdrawn in
the last four months of the year, the value and
cost of funding rose markedly;
• HSBC continued to focus on competitive
liability products, which led to a 16 per cent
growth in average deposits and current
accounts; this exceeded the 6 per cent rise in
average loans and advances to customers;
• there was an increased cost of funding HSBC’s
trading activities in HSBC’s overall result. Net
interest income includes the cost of funding
trading assets, while the related external
revenues are reported in trading income. In
HSBC’s customer group results, the cost of
funding trading assets is included within Global
Banking and Markets’ net trading income as an
interest expense; and
• balance sheet management revenues increased
compared with 2006. This was mainly due to
recovery in Asia.
In Europe, net interest income declined by
18 per cent. This was mainly driven by the
expansion of trading activities in both the UK and
France which resulted in higher funding costs, with
the related revenues reported in the trading income
line, as discussed above. This was partly offset by
higher net interest income in the personal and
commercial businesses.
In the UK, Personal Financial Services’
spreads widened in a rising interest rate environment
and competitive pricing attracted higher balances.
This was mitigated by lower spreads on mortgages
as customers switched to fixed rate products. In
Commercial Banking, higher net interest income was
largely driven by growth in the UK, Turkey,
Germany and Malta. The launch of a negotiated rate
deposit product in previous years continued to prove
successful in driving higher deposit balances. Strong
growth in corporate and structured banking for micro
customers, together with expansion in lending to
small and mid-market customers, contributed to
higher lending balances in the UK, although this