HSBC 2007 Annual Report Download - page 71
Download and view the complete annual report
Please find page 71 of the 2007 HSBC annual report below. You can navigate through the pages in the report by either clicking on the pages listed below, or by using the keyword search tool below to find specific information within the annual report.-
 1
1 -
2
-
3
-
4
-
5
-
6
-
7
-
8
-
9
-
10
-
11
-
12
-
13
-
14
-
15
-
16
-
17
-
18
-
19
-
20
-
21
-
22
-
23
-
24
-
25
-
26
-
27
-
28
-
29
-
30
-
31
-
32
-
33
-
34
-
35
-
36
-
37
-
38
-
39
-
40
-
41
-
42
-
43
-
44
-
45
-
46
-
47
-
48
-
49
-
50
-
51
-
52
-
53
-
54
-
55
-
56
-
57
-
58
-
59
-
60
-
 61
61 -
 62
62 -
 63
63 -
 64
64 -
 65
65 -
 66
66 -
 67
67 -
 68
68 -
 69
69 -
 70
70 -
 71
71 -
 72
72 -
 73
73 -
 74
74 -
 75
75 -
 76
76 -
 77
77 -
 78
78 -
 79
79 -
 80
80 -
 81
81 -
82
-
83
-
84
-
85
-
86
-
87
-
88
-
89
-
90
-
91
-
92
-
93
-
94
-
95
-
96
-
97
-
98
-
99
-
100
-
101
-
102
-
103
-
104
-
105
-
106
-
107
-
108
-
109
-
110
-
111
-
112
-
113
-
114
-
115
-
116
-
117
-
118
-
119
-
120
-
121
-
122
-
123
-
124
-
125
-
126
-
127
-
128
-
129
-
130
-
131
-
132
-
133
-
134
-
135
-
136
-
137
-
138
-
139
-
140
-
141
-
142
-
143
-
144
-
145
-
146
-
147
-
148
-
149
-
150
-
151
-
152
-
153
-
154
-
155
-
156
-
157
-
158
-
159
-
160
-
161
-
162
-
163
-
164
-
165
-
166
-
167
-
168
-
169
-
170
-
171
-
172
-
173
-
174
-
175
-
176
-
177
-
178
-
179
-
180
-
181
-
182
-
183
-
184
-
185
-
186
-
187
-
188
-
189
-
190
-
191
-
192
-
193
-
194
-
195
-
196
-
197
-
198
-
199
-
200
-
201
-
202
-
203
-
204
-
205
-
206
-
207
-
208
-
209
-
210
-
211
-
212
-
213
-
214
-
215
-
216
-
217
-
218
-
219
-
220
-
221
-
222
-
223
-
224
-
225
-
226
-
227
-
228
-
229
-
230
-
231
-
232
-
233
-
234
-
235
-
236
-
237
-
238
-
239
-
240
-
241
-
242
-
243
-
244
-
245
-
246
-
247
-
248
-
249
-
250
-
251
-
252
-
253
-
254
-
255
-
256
-
257
-
258
-
259
-
260
-
261
-
262
-
263
-
264
-
265
-
266
-
267
-
268
-
269
-
270
-
271
-
272
-
273
-
274
-
275
-
276
-
277
-
278
-
279
-
280
-
281
-
282
-
283
-
284
-
285
-
286
-
287
-
288
-
289
-
290
-
291
-
292
-
293
-
294
-
295
-
296
-
297
-
298
-
299
-
300
-
301
-
302
-
303
-
304
-
305
-
306
-
307
-
308
-
309
-
310
-
311
-
312
-
313
-
314
-
315
-
316
-
317
-
318
-
319
-
320
-
321
-
322
-
323
-
324
-
325
-
326
-
327
-
328
-
329
-
330
-
331
-
332
-
333
-
334
-
335
-
336
-
337
-
338
-
339
-
340
-
341
-
342
-
343
-
344
-
345
-
346
-
347
-
348
-
349
-
350
-
351
-
352
-
353
-
354
-
355
-
356
-
357
-
358
-
359
-
360
-
361
-
362
-
363
-
364
-
365
-
366
-
367
-
368
-
369
-
370
-
371
-
372
-
373
-
374
-
375
-
376
-
377
-
378
-
379
-
380
-
381
-
382
-
383
-
384
-
385
-
386
-
387
-
388
-
389
-
390
-
391
-
392
-
393
-
394
-
395
-
396
-
397
-
398
-
399
-
400
-
401
-
402
-
403
-
404
-
405
-
406
-
407
-
408
-
409
-
410
-
411
-
412
-
413
-
414
-
415
-
416
-
417
-
418
-
419
-
420
-
421
-
422
-
423
-
424
-
425
-
426
-
427
-
428
-
429
-
430
-
431
-
432
-
433
-
434
-
435
-
436
-
437
-
438
-
439
-
440
-
441
-
442
-
443
-
444
-
445
-
446
-
447
-
448
-
449
-
450
-
451
-
452
-
453
-
454
-
455
-
456
-
457
-
458
-
459
-
460
-
461
-
462
-
463
-
464
-
465
-
466
-
467
-
468
-
469
-
470
-
471
-
472
-
473
-
474
-
475
-
476
 |
 |

69
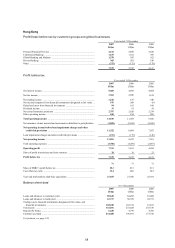
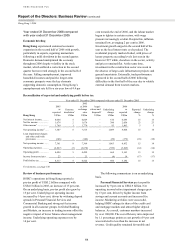
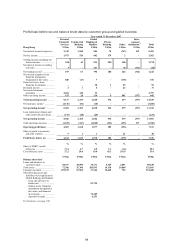
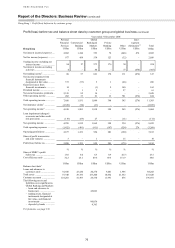
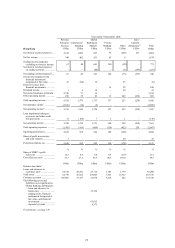
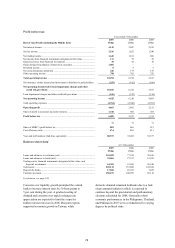
Profit/(loss) before tax and balance sheet data by customer group and global business
Year ended 31 December 2007
Hong Kong
Personal
Financial
Services
US$m
Commercial
Banking
US$m
Global
Banking &
Markets
US$m
Private
Banking
US$m
Other
US$m
Inter-
segment
elimination14
US$m
Total
US$m
Net interest income/(expense) .. .. 3,342 1,540 986 70 (767) 312 5,483
Net fee income ............................ 1,973 526 682 179 2 – 3,362
Trading income excluding net
interest income ....................... 188 63 553 280 186 – 1,270
Net interest income on trading
activities .................................. 5 –241 –38 (312) (28)
Net trading income5..................... 193 63 794 280 224 (312) 1,242
Net income/(expense) from
financial instruments
designated at fair value ........... 820 (13) 7 – (138) – 676
Gains less losses from
financial investments .............. – – 38 1 55 – 94
Dividend income ......................... 2 1 6 – 22 – 31
Net earned insurance
premiums ................................ 2,654 130 13 – – – 2,797
Other operating income .............. 153 28 114 6 881 (337) 845
Total operating income ............ 9,137 2,275 2,640 536 279 (337) 14,530
Net insurance claims6 ................. (3,116) (82) (10) – – – (3,208)
Net operating income4 .............. 6,021 2,193 2,630 536 279 (337) 11,322
Loan impairment charges and
other credit risk provisions ..... (175) (28) (28) – – – (231)
Net operating income ............... 5,846 2,165 2,602 536 279 (337) 11,091
Total operating expenses ............ (1,639) (547) (1,025) (231) (675) 337 (3,780)
Operating profit/(loss) .............. 4,207 1,618 1,577 305 (396) – 7,311
Share of profit in associates
and joint ventures ................... 5 1 1 – 21 – 28
Profit/(loss) before tax .............. 4,212 1,619 1,578 305 (375) – 7,339
% % % % % %
Share of HSBC’s profit
before tax ................................ 17.4 6.7 6.5 1.3 (1.6) 30.3
Cost efficiency ratio ................... 27.2 24.9 39.0 43.1 241.9 33.4
US$m US$m US$m US$m US$m US$m
Balance sheet data7
Loans and advances to
customers (net) ....................... 38,197 25,890 19,171 4,329 2,051 89,638
Total assets ................................. 72,386 35,366 185,933 14,138 24,868 332,691
Customer accounts ...................... 129,159 51,562 37,364 15,649 754 234,488
The following assets and
liabilities were significant to
Global Banking and Markets:
– loans and advances to
banks (net) .......................... 53,725
– trading assets, financial
instruments designated at
fair value, and financial
investments ......................... 74,189
– deposits by banks ............... 6,251
For footnotes, see page 130.