HSBC 2007 Annual Report Download - page 242
Download and view the complete annual report
Please find page 242 of the 2007 HSBC annual report below. You can navigate through the pages in the report by either clicking on the pages listed below, or by using the keyword search tool below to find specific information within the annual report.-
 1
1 -
2
-
3
-
4
-
5
-
6
-
7
-
8
-
9
-
10
-
11
-
12
-
13
-
14
-
15
-
16
-
17
-
18
-
19
-
20
-
21
-
22
-
23
-
24
-
25
-
26
-
27
-
28
-
29
-
30
-
31
-
32
-
33
-
34
-
35
-
36
-
37
-
38
-
39
-
40
-
41
-
42
-
43
-
44
-
45
-
46
-
47
-
48
-
49
-
50
-
51
-
52
-
53
-
54
-
55
-
56
-
57
-
58
-
59
-
60
-
61
-
62
-
63
-
64
-
65
-
66
-
67
-
68
-
69
-
70
-
71
-
72
-
73
-
74
-
75
-
76
-
77
-
78
-
79
-
80
-
81
-
82
-
83
-
84
-
85
-
86
-
87
-
88
-
89
-
90
-
91
-
92
-
93
-
94
-
95
-
96
-
97
-
98
-
99
-
100
-
101
-
102
-
103
-
104
-
105
-
106
-
107
-
108
-
109
-
110
-
111
-
112
-
113
-
114
-
115
-
116
-
117
-
118
-
119
-
120
-
121
-
122
-
123
-
124
-
125
-
126
-
127
-
128
-
129
-
130
-
131
-
132
-
133
-
134
-
135
-
136
-
137
-
138
-
139
-
140
-
141
-
142
-
143
-
144
-
145
-
146
-
147
-
148
-
149
-
150
-
151
-
152
-
153
-
154
-
155
-
156
-
157
-
158
-
159
-
160
-
161
-
162
-
163
-
164
-
165
-
166
-
167
-
168
-
169
-
170
-
171
-
172
-
173
-
174
-
175
-
176
-
177
-
178
-
179
-
180
-
181
-
182
-
183
-
184
-
185
-
186
-
187
-
188
-
189
-
190
-
191
-
192
-
193
-
194
-
195
-
196
-
197
-
198
-
199
-
200
-
201
-
202
-
203
-
204
-
205
-
206
-
207
-
208
-
209
-
210
-
211
-
212
-
213
-
214
-
215
-
216
-
217
-
218
-
219
-
220
-
221
-
222
-
223
-
224
-
225
-
226
-
227
-
228
-
229
-
230
-
231
-
 232
232 -
 233
233 -
 234
234 -
 235
235 -
 236
236 -
 237
237 -
 238
238 -
 239
239 -
 240
240 -
 241
241 -
 242
242 -
 243
243 -
 244
244 -
 245
245 -
 246
246 -
 247
247 -
 248
248 -
 249
249 -
 250
250 -
 251
251 -
 252
252 -
253
-
254
-
255
-
256
-
257
-
258
-
259
-
260
-
261
-
262
-
263
-
264
-
265
-
266
-
267
-
268
-
269
-
270
-
271
-
272
-
273
-
274
-
275
-
276
-
277
-
278
-
279
-
280
-
281
-
282
-
283
-
284
-
285
-
286
-
287
-
288
-
289
-
290
-
291
-
292
-
293
-
294
-
295
-
296
-
297
-
298
-
299
-
300
-
301
-
302
-
303
-
304
-
305
-
306
-
307
-
308
-
309
-
310
-
311
-
312
-
313
-
314
-
315
-
316
-
317
-
318
-
319
-
320
-
321
-
322
-
323
-
324
-
325
-
326
-
327
-
328
-
329
-
330
-
331
-
332
-
333
-
334
-
335
-
336
-
337
-
338
-
339
-
340
-
341
-
342
-
343
-
344
-
345
-
346
-
347
-
348
-
349
-
350
-
351
-
352
-
353
-
354
-
355
-
356
-
357
-
358
-
359
-
360
-
361
-
362
-
363
-
364
-
365
-
366
-
367
-
368
-
369
-
370
-
371
-
372
-
373
-
374
-
375
-
376
-
377
-
378
-
379
-
380
-
381
-
382
-
383
-
384
-
385
-
386
-
387
-
388
-
389
-
390
-
391
-
392
-
393
-
394
-
395
-
396
-
397
-
398
-
399
-
400
-
401
-
402
-
403
-
404
-
405
-
406
-
407
-
408
-
409
-
410
-
411
-
412
-
413
-
414
-
415
-
416
-
417
-
418
-
419
-
420
-
421
-
422
-
423
-
424
-
425
-
426
-
427
-
428
-
429
-
430
-
431
-
432
-
433
-
434
-
435
-
436
-
437
-
438
-
439
-
440
-
441
-
442
-
443
-
444
-
445
-
446
-
447
-
448
-
449
-
450
-
451
-
452
-
453
-
454
-
455
-
456
-
457
-
458
-
459
-
460
-
461
-
462
-
463
-
464
-
465
-
466
-
467
-
468
-
469
-
470
-
471
-
472
-
473
-
474
-
475
-
476
 |
 |

HSBC HOLDINGS PLC
Report of the Directors: The Management of Risk (continued)
Credit risk > Loan impairment charge / HSBC Holdings / Risk elements
240
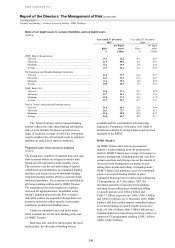
Canada, as the strong economy continued to
underpin good credit quality.
Releases and recoveries in North America
decreased by 23 per cent to US$146 million due to
the non-recurrence of recoveries in the US.
In Latin America, new impairment charges
rose by 24 per cent to US$1.1 billion in 2006. This
increase was chiefly attributable to Mexico and, to a
lesser extent, Brazil. Strong growth in personal and
commercial lending in Mexico resulted in higher
new charges. In Brazil, new charges rose by 11 per
cent, a significant reduction from the 52 per cent rise
reported in 2005, as credit quality improved
following enhancements made to underwriting
procedures during 2005 and 2006.
Latin American releases and recoveries went up
by 7 per cent, largely in Mexico as a result of more
stable political and economic conditions.
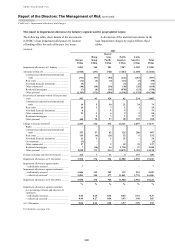
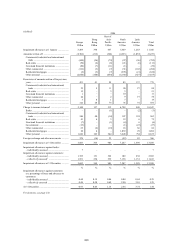
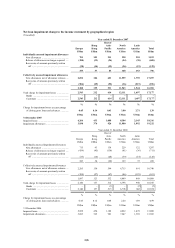
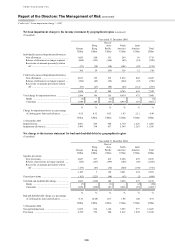
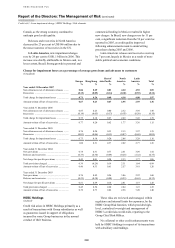
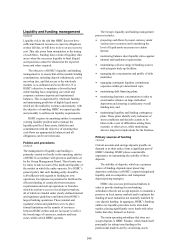
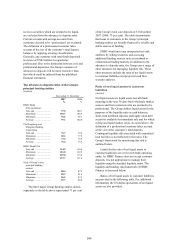
Charge for impairment losses as a percentage of average gross loans and advances to customers
(Unaudited)
Europe
%
Hong Kong
%
Rest of
Asia-Pacific
%
North
America
%
Latin
America
%
Total
%
Year ended 31 December 2007
New allowances net of allowance releases ........ 0.86 0.29 0.83 4.20 4.55 2.09
Recoveries .......................................................... (0.15) (0.05) (0.14) (0.02) (0.55) (0.12)
Total charge for impairment losses .................... 0.71 0.24 0.69 4.18 4.00 1.97
Amount written off net of recoveries ................. 0.67 0.23 0.67 2.55 2.95 1.36
Year ended 31 December 2006
New allowances net of allowance releases ........ 0.87 0.23 0.80 2.52 3.95 1.49
Recoveries .......................................................... (0.14) (0.05) (0.13) (0.03) (0.50) (0.10)
Total charge for impairment losses .................... 0.73 0.18 0.67 2.49 3.45 1.39
Amount written off net of recoveries ................. 0.77 0.20 0.62 1.77 3.36 1.15
Year ended 31 December 2005
New allowances net of allowance releases ........ 0.76 0.24 0.33 2.15 3.97 1.25
Recoveries .......................................................... (0.03) (0.06) (0.13) (0.07) (0.68) (0.09)
Total charge for impairment losses .................... 0.73 0.18 0.20 2.08 3.29 1.16
Amount written off net of recoveries ................. 1.00 0.31 0.37 2.02 2.77 1.26
Year ended 31 December 2004
New provisions ................................................... 0.78 0.31 0.77 2.61 3.09 1.41
Releases and recoveries ...................................... (0.33) (0.30) (0.49) (0.28) (1.32) (0.35)
Net charge for specific provisions ...................... 0.45 0.01 0.28 2.33 1.77 1.06
Total provisions charged .................................... 0.39 (0.29) 0.19 2.31 1.64 0.99
Amount written off net of recoveries ................. 0.46 0.33 0.61 2.57 3.41 1.26
Year ended 31 December 2003
New provisions ................................................... 0.76 0.89 0.96 3.06 2.22 1.60
Releases and recoveries ...................................... (0.25) (0.30) (0.80) (0.25) (0.65) (0.32)
Net charge for specific provisions ...................... 0.51 0.59 0.16 2.81 1.57 1.28
Total provisions charged .................................... 0.45 0.54 0.20 2.84 1.23 1.25
Amount written off net of recoveries ................. 0.39 0.73 0.86 2.58 7.20 1.40
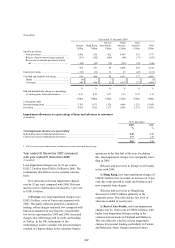
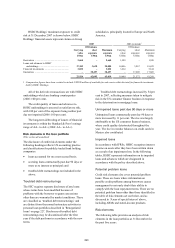
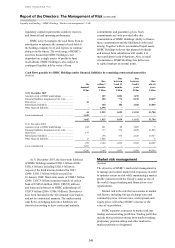
HSBC Holdings
(Audited)
Credit risk arises in HSBC Holdings primarily as a
result of transactions with Group subsidiaries as well
as guarantees issued in support of obligations
incurred by some Group businesses in the normal
conduct of their business.
These risks are reviewed and managed, within
regulatory and internal limits for exposures, by the
HSBC Group Risk function, which provides high-
level, centralised oversight and management of
HSBC’s credit risks world-wide, reporting to the
Group Chief Risk Officer.
No collateral or other credit enhancements were
held by HSBC Holdings in respect of its transactions
with subsidiary undertakings.