HSBC 2007 Annual Report Download - page 102
Download and view the complete annual report
Please find page 102 of the 2007 HSBC annual report below. You can navigate through the pages in the report by either clicking on the pages listed below, or by using the keyword search tool below to find specific information within the annual report.-
 1
1 -
2
-
3
-
4
-
5
-
6
-
7
-
8
-
9
-
10
-
11
-
12
-
13
-
14
-
15
-
16
-
17
-
18
-
19
-
20
-
21
-
22
-
23
-
24
-
25
-
26
-
27
-
28
-
29
-
30
-
31
-
32
-
33
-
34
-
35
-
36
-
37
-
38
-
39
-
40
-
41
-
42
-
43
-
44
-
45
-
46
-
47
-
48
-
49
-
50
-
51
-
52
-
53
-
54
-
55
-
56
-
57
-
58
-
59
-
60
-
61
-
62
-
63
-
64
-
65
-
66
-
67
-
68
-
69
-
70
-
71
-
72
-
73
-
74
-
75
-
76
-
77
-
78
-
79
-
80
-
81
-
82
-
83
-
84
-
85
-
86
-
87
-
88
-
89
-
90
-
91
-
 92
92 -
 93
93 -
 94
94 -
 95
95 -
 96
96 -
 97
97 -
 98
98 -
 99
99 -
 100
100 -
 101
101 -
 102
102 -
 103
103 -
 104
104 -
 105
105 -
 106
106 -
 107
107 -
 108
108 -
 109
109 -
 110
110 -
 111
111 -
 112
112 -
113
-
114
-
115
-
116
-
117
-
118
-
119
-
120
-
121
-
122
-
123
-
124
-
125
-
126
-
127
-
128
-
129
-
130
-
131
-
132
-
133
-
134
-
135
-
136
-
137
-
138
-
139
-
140
-
141
-
142
-
143
-
144
-
145
-
146
-
147
-
148
-
149
-
150
-
151
-
152
-
153
-
154
-
155
-
156
-
157
-
158
-
159
-
160
-
161
-
162
-
163
-
164
-
165
-
166
-
167
-
168
-
169
-
170
-
171
-
172
-
173
-
174
-
175
-
176
-
177
-
178
-
179
-
180
-
181
-
182
-
183
-
184
-
185
-
186
-
187
-
188
-
189
-
190
-
191
-
192
-
193
-
194
-
195
-
196
-
197
-
198
-
199
-
200
-
201
-
202
-
203
-
204
-
205
-
206
-
207
-
208
-
209
-
210
-
211
-
212
-
213
-
214
-
215
-
216
-
217
-
218
-
219
-
220
-
221
-
222
-
223
-
224
-
225
-
226
-
227
-
228
-
229
-
230
-
231
-
232
-
233
-
234
-
235
-
236
-
237
-
238
-
239
-
240
-
241
-
242
-
243
-
244
-
245
-
246
-
247
-
248
-
249
-
250
-
251
-
252
-
253
-
254
-
255
-
256
-
257
-
258
-
259
-
260
-
261
-
262
-
263
-
264
-
265
-
266
-
267
-
268
-
269
-
270
-
271
-
272
-
273
-
274
-
275
-
276
-
277
-
278
-
279
-
280
-
281
-
282
-
283
-
284
-
285
-
286
-
287
-
288
-
289
-
290
-
291
-
292
-
293
-
294
-
295
-
296
-
297
-
298
-
299
-
300
-
301
-
302
-
303
-
304
-
305
-
306
-
307
-
308
-
309
-
310
-
311
-
312
-
313
-
314
-
315
-
316
-
317
-
318
-
319
-
320
-
321
-
322
-
323
-
324
-
325
-
326
-
327
-
328
-
329
-
330
-
331
-
332
-
333
-
334
-
335
-
336
-
337
-
338
-
339
-
340
-
341
-
342
-
343
-
344
-
345
-
346
-
347
-
348
-
349
-
350
-
351
-
352
-
353
-
354
-
355
-
356
-
357
-
358
-
359
-
360
-
361
-
362
-
363
-
364
-
365
-
366
-
367
-
368
-
369
-
370
-
371
-
372
-
373
-
374
-
375
-
376
-
377
-
378
-
379
-
380
-
381
-
382
-
383
-
384
-
385
-
386
-
387
-
388
-
389
-
390
-
391
-
392
-
393
-
394
-
395
-
396
-
397
-
398
-
399
-
400
-
401
-
402
-
403
-
404
-
405
-
406
-
407
-
408
-
409
-
410
-
411
-
412
-
413
-
414
-
415
-
416
-
417
-
418
-
419
-
420
-
421
-
422
-
423
-
424
-
425
-
426
-
427
-
428
-
429
-
430
-
431
-
432
-
433
-
434
-
435
-
436
-
437
-
438
-
439
-
440
-
441
-
442
-
443
-
444
-
445
-
446
-
447
-
448
-
449
-
450
-
451
-
452
-
453
-
454
-
455
-
456
-
457
-
458
-
459
-
460
-
461
-
462
-
463
-
464
-
465
-
466
-
467
-
468
-
469
-
470
-
471
-
472
-
473
-
474
-
475
-
476
 |
 |

HSBC HOLDINGS PLC
Report of the Directors: Business Review (continued)
North America > 2006
100
services business within HSBC Finance, as slowing
house price appreciation and the projected effect of
interest rate resets impacted loss estimates from
rising credit delinquency. This is described more
fully below and on page 221. In Commercial
Banking, investment in distribution channels
delivered growth from increased lending and deposit
taking. In Global Banking and Markets, strong
trading results more than offset lower balance sheet
management revenues, which were constrained by
compressed spreads in a flat interest rate yield curve
environment. Underlying operating expenses
increased by 13 per cent to support investment in
business expansion and branch openings in the
Personal Financial Services business.
The commentary that follows is on an
underlying basis.
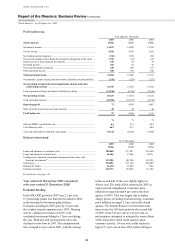
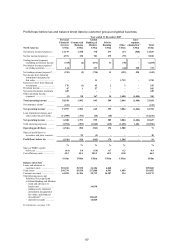
Reconciliation of reported and underlying profit before tax
Year ended 31 December 2006 compared with year ended 31 December 2005
North America
2005
as
reported
US$m
Currency
translation1
US$m
2005
at 2006
exchange
rates
US$m
Acqui-
sitions and
disposals2
US$m
Underlying
change
US$m
2006
as
reported
US$m
Reported
change
%
Underlying
change
%
Net interest income .......... 13,295 56 13,351 528 389 14,268 7 3
Net fee income ................. 3,952 21 3,973 225 568 4,766 21 14
Other income3 .................. 2,294 9 2,303 13 277 2,593 13 12
Net operating income4 ..... 19,541 86 19,627 766 1,234 21,627 11 6
Loan impairment charges
and other credit risk
provisions .................... (4,916) 3 (4,913) (291) (1,592) (6,796) (38) (32)
Net operating income ...... 14,625 89 14,714 475 (358) 14,831 1 (2)
Operating expenses .......... (8,758) (43) (8,801) (291) (1,101) (10,193) (16) (13)
Operating profit ............... 5,867 46 5,913 184 (1,459) 4,638 (21) (25)
Income from associates ... 48 – 48 – (18) 30 (38) (38)
Profit before tax ............... 5,915 46 5,961 184 (1,477) 4,668 (21) (25)
For footnotes, see page 130.
Personal Financial Services generated a pre-
tax profit of US$3.4 billion, a decrease of 23 per cent
compared with 2005. Net operating income rose at a
slower rate than cost growth, due to constrained
balance sheet growth in the second half of the year,
higher collection expense and significantly higher
loan impairment charges. The increased loan
impairment charges recognised in respect of HSBC
Finance’s correspondent mortgage services business
more than offset the non-recurrence of charges
arising in respect of hurricane Katrina and the
change in bankruptcy legislation in 2005. The cost
efficiency ratio worsened as costs rose faster than
revenues.
In the US, pre-tax profit of US$3.1 billion was
24 per cent lower than in 2005, reflecting the
significantly higher loan impairment charges noted
above and additional costs incurred in support of
business expansion in both the consumer finance
company and the retail bank. Beginning in 2004,
HSBC implemented a growth strategy for its core
banking network in the US which included building
deposits over a three to five year period across
multiple markets and segments utilising diverse
delivery systems. During 2006 the strategy included
various initiatives, the most important of these being
growing the deposit base by emphasising more
competitive pricing and introducing high yielding
products, including internet savings accounts. These
have grown significantly since late 2005 to
US$7 billion, of which US$6 billion arose in 2006
and US$5 billion of the 2006 growth was from new
customers. Retail branch expansion in existing and
new geographic markets was also a key initiative,
with 25 new branches opened in 2006.
In Canada, profit before tax was 21 per cent
lower, partly due to the absence of provision releases
made in 2005 in the core banking operations.
Revenues rose but this was offset by costs incurred
in support of expansion in consumer finance and
investments made in the bank distribution channels.
Net interest income of US$13.0 billion was
7 per cent higher than in 2005. In the US, there was
strong growth in mortgages, cards and other personal
non-credit card lending, particularly in the first half
of the year, and this, coupled with higher deposit
balances, led to a 6 per cent increase in net interest