HSBC 2007 Annual Report Download - page 158
Download and view the complete annual report
Please find page 158 of the 2007 HSBC annual report below. You can navigate through the pages in the report by either clicking on the pages listed below, or by using the keyword search tool below to find specific information within the annual report.-
 1
1 -
2
-
3
-
4
-
5
-
6
-
7
-
8
-
9
-
10
-
11
-
12
-
13
-
14
-
15
-
16
-
17
-
18
-
19
-
20
-
21
-
22
-
23
-
24
-
25
-
26
-
27
-
28
-
29
-
30
-
31
-
32
-
33
-
34
-
35
-
36
-
37
-
38
-
39
-
40
-
41
-
42
-
43
-
44
-
45
-
46
-
47
-
48
-
49
-
50
-
51
-
52
-
53
-
54
-
55
-
56
-
57
-
58
-
59
-
60
-
61
-
62
-
63
-
64
-
65
-
66
-
67
-
68
-
69
-
70
-
71
-
72
-
73
-
74
-
75
-
76
-
77
-
78
-
79
-
80
-
81
-
82
-
83
-
84
-
85
-
86
-
87
-
88
-
89
-
90
-
91
-
92
-
93
-
94
-
95
-
96
-
97
-
98
-
99
-
100
-
101
-
102
-
103
-
104
-
105
-
106
-
107
-
108
-
109
-
110
-
111
-
112
-
113
-
114
-
115
-
116
-
117
-
118
-
119
-
120
-
121
-
122
-
123
-
124
-
125
-
126
-
127
-
128
-
129
-
130
-
131
-
132
-
133
-
134
-
135
-
136
-
137
-
138
-
139
-
140
-
141
-
142
-
143
-
144
-
145
-
146
-
147
-
 148
148 -
 149
149 -
 150
150 -
 151
151 -
 152
152 -
 153
153 -
 154
154 -
 155
155 -
 156
156 -
 157
157 -
 158
158 -
 159
159 -
 160
160 -
 161
161 -
 162
162 -
 163
163 -
 164
164 -
 165
165 -
 166
166 -
 167
167 -
 168
168 -
169
-
170
-
171
-
172
-
173
-
174
-
175
-
176
-
177
-
178
-
179
-
180
-
181
-
182
-
183
-
184
-
185
-
186
-
187
-
188
-
189
-
190
-
191
-
192
-
193
-
194
-
195
-
196
-
197
-
198
-
199
-
200
-
201
-
202
-
203
-
204
-
205
-
206
-
207
-
208
-
209
-
210
-
211
-
212
-
213
-
214
-
215
-
216
-
217
-
218
-
219
-
220
-
221
-
222
-
223
-
224
-
225
-
226
-
227
-
228
-
229
-
230
-
231
-
232
-
233
-
234
-
235
-
236
-
237
-
238
-
239
-
240
-
241
-
242
-
243
-
244
-
245
-
246
-
247
-
248
-
249
-
250
-
251
-
252
-
253
-
254
-
255
-
256
-
257
-
258
-
259
-
260
-
261
-
262
-
263
-
264
-
265
-
266
-
267
-
268
-
269
-
270
-
271
-
272
-
273
-
274
-
275
-
276
-
277
-
278
-
279
-
280
-
281
-
282
-
283
-
284
-
285
-
286
-
287
-
288
-
289
-
290
-
291
-
292
-
293
-
294
-
295
-
296
-
297
-
298
-
299
-
300
-
301
-
302
-
303
-
304
-
305
-
306
-
307
-
308
-
309
-
310
-
311
-
312
-
313
-
314
-
315
-
316
-
317
-
318
-
319
-
320
-
321
-
322
-
323
-
324
-
325
-
326
-
327
-
328
-
329
-
330
-
331
-
332
-
333
-
334
-
335
-
336
-
337
-
338
-
339
-
340
-
341
-
342
-
343
-
344
-
345
-
346
-
347
-
348
-
349
-
350
-
351
-
352
-
353
-
354
-
355
-
356
-
357
-
358
-
359
-
360
-
361
-
362
-
363
-
364
-
365
-
366
-
367
-
368
-
369
-
370
-
371
-
372
-
373
-
374
-
375
-
376
-
377
-
378
-
379
-
380
-
381
-
382
-
383
-
384
-
385
-
386
-
387
-
388
-
389
-
390
-
391
-
392
-
393
-
394
-
395
-
396
-
397
-
398
-
399
-
400
-
401
-
402
-
403
-
404
-
405
-
406
-
407
-
408
-
409
-
410
-
411
-
412
-
413
-
414
-
415
-
416
-
417
-
418
-
419
-
420
-
421
-
422
-
423
-
424
-
425
-
426
-
427
-
428
-
429
-
430
-
431
-
432
-
433
-
434
-
435
-
436
-
437
-
438
-
439
-
440
-
441
-
442
-
443
-
444
-
445
-
446
-
447
-
448
-
449
-
450
-
451
-
452
-
453
-
454
-
455
-
456
-
457
-
458
-
459
-
460
-
461
-
462
-
463
-
464
-
465
-
466
-
467
-
468
-
469
-
470
-
471
-
472
-
473
-
474
-
475
-
476
 |
 |

HSBC HOLDINGS PLC
Report of the Directors: Financial Review (continued)
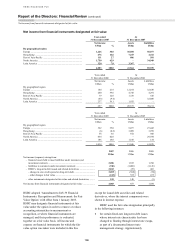
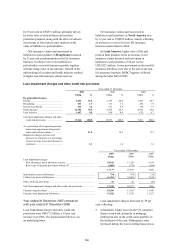
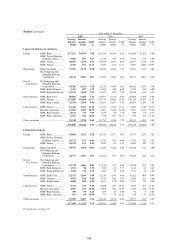
Operating expenses
156
settlement accounts), compared with 1.5 per cent at
the same time in 2005.
Impaired loans to customers were
US$13.8 billion at 31 December 2006
compared with US$11.4 billion at 31 December
2005. On a constant currency basis, impaired loans
were 14 per cent higher than in 2005 compared with
lending growth (excluding loans to the financial
sector and settlement accounts) of 10 per cent.
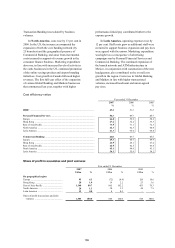
Operating expenses
Year ended 31 December
2007 2006 2005
US$m % US$m % US$m %
By geographical region
Europe ...................................................... 16,525 40.3 13,871 39.6 12,639 41.4
Hong Kong .............................................. 3,780 9.2 3,269 9.3 2,867 9.4
Rest of Asia-Pacific ................................. 4,764 11.6 3,548 10.1 2,762 9.1
North America ......................................... 10,556 25.7 10,193 29.1 8,758 28.8
Latin America .......................................... 5,402 13.2 4,166 11.9 3,426 11.3
41,027 100.0 35,047 100.0 30,452 100.0
Intra-HSBC elimination ........................... (1,985) (1,494) (938)
Total operating expenses ......................... 39,042 33,553 29,514
Year ended 31 December
2007 2006 2005
US$m US$m US$m
By expense category
Employee compensation and benefits1 ............................................................ 21,334 18,500 16,145
Premises and equipment (excluding depreciation and impairment) ............... 3,966 3,389 2,977
General and administrative expenses .............................................................. 11,328 9,434 8,206
Administrative expenses .................................................................................. 36,628 31,323 27,328
Depreciation and impairment of property, plant and equipment .................... 1,714 1,514 1,632
Amortisation and impairment of intangible assets .......................................... 700 716 554
Total operating expenses ................................................................................. 39,042 33,553 29,514
At 31 December
2007 2006 2005
Staff numbers (full-time equivalent)
Europe .............................................................................................................. 82,166 78,311 77,755
Hong Kong ...................................................................................................... 27,655 27,586 25,931
Rest of Asia-Pacific ......................................................................................... 88,573 72,265 55,577
North America ................................................................................................. 52,722 55,642 53,608
Latin America2 ................................................................................................. 64,404 64,900 55,600
Total staff numbers .......................................................................................... 315,520 298,704 268,471
1 A charge of US$135 million was realised in 2006 arising from the waiver of the TSR-related performance condition in respect of the
2003 awards under the HSBC Holdings Group Share Option Plan (‘the Plan’). As explained in the Annual Report and Accounts 2005,
in light of the impressive and sustained performance and shareholder returns over the three years covered by the 2003 awards, the
Group Remuneration Committee exercised its discretion, as permitted within the Plan, to waive the TSR performance condition. Under
IFRSs, this is treated as a modification which requires an additional accounting charge: this is a non-cash item.
2 Comparative information for 2006 has been restated to bring numbers for Latin America into line with the criteria for the recognition of
full-time equivalent staff used in 2007.
Year ended 31 December 2007 compared
with year ended 31 December 2006
Operating expenses increased by US$5.5 billion to
US$39.0 billion. On an underlying basis, cost growth
was 10 per cent, the main drivers being:
• Costs rose in Europe, mainly driven by staff
costs in the UK and France and non-staff costs
in the UK. The increase in staff costs was driven
by a mixture of higher staff benefits and higher
headcount in the region. A change in actuarial
assumptions regarding the employees’ defined
contribution pension scheme in the UK also
contributed to the increase. General and
administrative expenses were driven by ex
gratia payments expensed in respect of overdraft
fees applied in previous years and a provision
for reimbursement of certain charges on historic
will trusts and other related services, both in the
UK.