HSBC 2007 Annual Report Download - page 74
Download and view the complete annual report
Please find page 74 of the 2007 HSBC annual report below. You can navigate through the pages in the report by either clicking on the pages listed below, or by using the keyword search tool below to find specific information within the annual report.-
 1
1 -
2
-
3
-
4
-
5
-
6
-
7
-
8
-
9
-
10
-
11
-
12
-
13
-
14
-
15
-
16
-
17
-
18
-
19
-
20
-
21
-
22
-
23
-
24
-
25
-
26
-
27
-
28
-
29
-
30
-
31
-
32
-
33
-
34
-
35
-
36
-
37
-
38
-
39
-
40
-
41
-
42
-
43
-
44
-
45
-
46
-
47
-
48
-
49
-
50
-
51
-
52
-
53
-
54
-
55
-
56
-
57
-
58
-
59
-
60
-
61
-
62
-
63
-
 64
64 -
 65
65 -
 66
66 -
 67
67 -
 68
68 -
 69
69 -
 70
70 -
 71
71 -
 72
72 -
 73
73 -
 74
74 -
 75
75 -
 76
76 -
 77
77 -
 78
78 -
 79
79 -
 80
80 -
 81
81 -
 82
82 -
 83
83 -
 84
84 -
85
-
86
-
87
-
88
-
89
-
90
-
91
-
92
-
93
-
94
-
95
-
96
-
97
-
98
-
99
-
100
-
101
-
102
-
103
-
104
-
105
-
106
-
107
-
108
-
109
-
110
-
111
-
112
-
113
-
114
-
115
-
116
-
117
-
118
-
119
-
120
-
121
-
122
-
123
-
124
-
125
-
126
-
127
-
128
-
129
-
130
-
131
-
132
-
133
-
134
-
135
-
136
-
137
-
138
-
139
-
140
-
141
-
142
-
143
-
144
-
145
-
146
-
147
-
148
-
149
-
150
-
151
-
152
-
153
-
154
-
155
-
156
-
157
-
158
-
159
-
160
-
161
-
162
-
163
-
164
-
165
-
166
-
167
-
168
-
169
-
170
-
171
-
172
-
173
-
174
-
175
-
176
-
177
-
178
-
179
-
180
-
181
-
182
-
183
-
184
-
185
-
186
-
187
-
188
-
189
-
190
-
191
-
192
-
193
-
194
-
195
-
196
-
197
-
198
-
199
-
200
-
201
-
202
-
203
-
204
-
205
-
206
-
207
-
208
-
209
-
210
-
211
-
212
-
213
-
214
-
215
-
216
-
217
-
218
-
219
-
220
-
221
-
222
-
223
-
224
-
225
-
226
-
227
-
228
-
229
-
230
-
231
-
232
-
233
-
234
-
235
-
236
-
237
-
238
-
239
-
240
-
241
-
242
-
243
-
244
-
245
-
246
-
247
-
248
-
249
-
250
-
251
-
252
-
253
-
254
-
255
-
256
-
257
-
258
-
259
-
260
-
261
-
262
-
263
-
264
-
265
-
266
-
267
-
268
-
269
-
270
-
271
-
272
-
273
-
274
-
275
-
276
-
277
-
278
-
279
-
280
-
281
-
282
-
283
-
284
-
285
-
286
-
287
-
288
-
289
-
290
-
291
-
292
-
293
-
294
-
295
-
296
-
297
-
298
-
299
-
300
-
301
-
302
-
303
-
304
-
305
-
306
-
307
-
308
-
309
-
310
-
311
-
312
-
313
-
314
-
315
-
316
-
317
-
318
-
319
-
320
-
321
-
322
-
323
-
324
-
325
-
326
-
327
-
328
-
329
-
330
-
331
-
332
-
333
-
334
-
335
-
336
-
337
-
338
-
339
-
340
-
341
-
342
-
343
-
344
-
345
-
346
-
347
-
348
-
349
-
350
-
351
-
352
-
353
-
354
-
355
-
356
-
357
-
358
-
359
-
360
-
361
-
362
-
363
-
364
-
365
-
366
-
367
-
368
-
369
-
370
-
371
-
372
-
373
-
374
-
375
-
376
-
377
-
378
-
379
-
380
-
381
-
382
-
383
-
384
-
385
-
386
-
387
-
388
-
389
-
390
-
391
-
392
-
393
-
394
-
395
-
396
-
397
-
398
-
399
-
400
-
401
-
402
-
403
-
404
-
405
-
406
-
407
-
408
-
409
-
410
-
411
-
412
-
413
-
414
-
415
-
416
-
417
-
418
-
419
-
420
-
421
-
422
-
423
-
424
-
425
-
426
-
427
-
428
-
429
-
430
-
431
-
432
-
433
-
434
-
435
-
436
-
437
-
438
-
439
-
440
-
441
-
442
-
443
-
444
-
445
-
446
-
447
-
448
-
449
-
450
-
451
-
452
-
453
-
454
-
455
-
456
-
457
-
458
-
459
-
460
-
461
-
462
-
463
-
464
-
465
-
466
-
467
-
468
-
469
-
470
-
471
-
472
-
473
-
474
-
475
-
476
 |
 |
HSBC HOLDINGS PLC
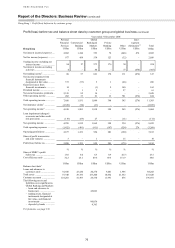
Report of the Directors: Business Review (continued)
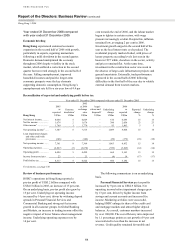
Rest of Asia-Pacific > Profit/(loss) before tax
72
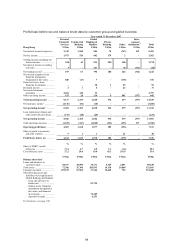
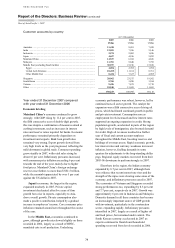
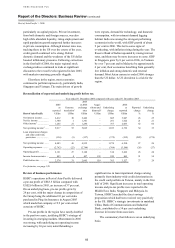
Rest of Asia-Pacific (including the Middle East)
Profit/(loss) before tax by country within customer groups and global businesses
Personal
Financial
Services
US$m
Commercial
Banking
US$m
Global
Banking &
Markets
US$m
Private
Banking
US$m
Other
US$m
Total
US$m
Year to 31 December 2007
Australia ............................................................ 41 37 42 – 4 124
India .................................................................. (70) 88 429 (1) 83 529
Indonesia ........................................................... (7) 29 86 – (4) 104
Japan ................................................................. (34) (3) 75 – 5 43
Mainland China ................................................ 494 397 369 – 1,101 2,361
Associates ..................................................... 516 351 220 – 1,093 2,180
Other mainland China .................................. (22) 46 149 – 8 181
Malaysia ............................................................ 81 90 146 – 13 330
Middle East ....................................................... 245 482 495 3 82 1,307
Egypt ............................................................ 10 46 65 – 32 153
United Arab Emirates ................................... 108 262 242 3 2 617
Other Middle East ........................................ 83 101 116 – – 300
Middle East (excluding Saudi Arabia) ......... 201 409 423 3 34 1,070
Saudi Arabia ................................................. 44 73 72 – 48 237
Singapore .......................................................... 101 112 240 90 7 550
South Korea ...................................................... (44) (20) 159 – 28 123
Taiwan .............................................................. (52) 27 144 – 4 123
Other ................................................................. 5 111 279 – 20 415
760 1,350 2,464 92 1,343 6,009
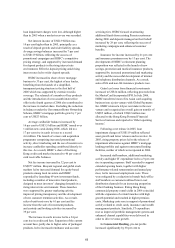
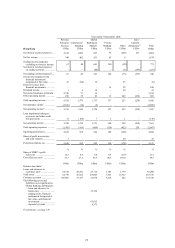
Personal
Financial
Services
US$m
Commercial
Banking
US$m
Global
Banking &
Markets
US$m
Private
Banking
US$m
Other
US$m
Total
US$m
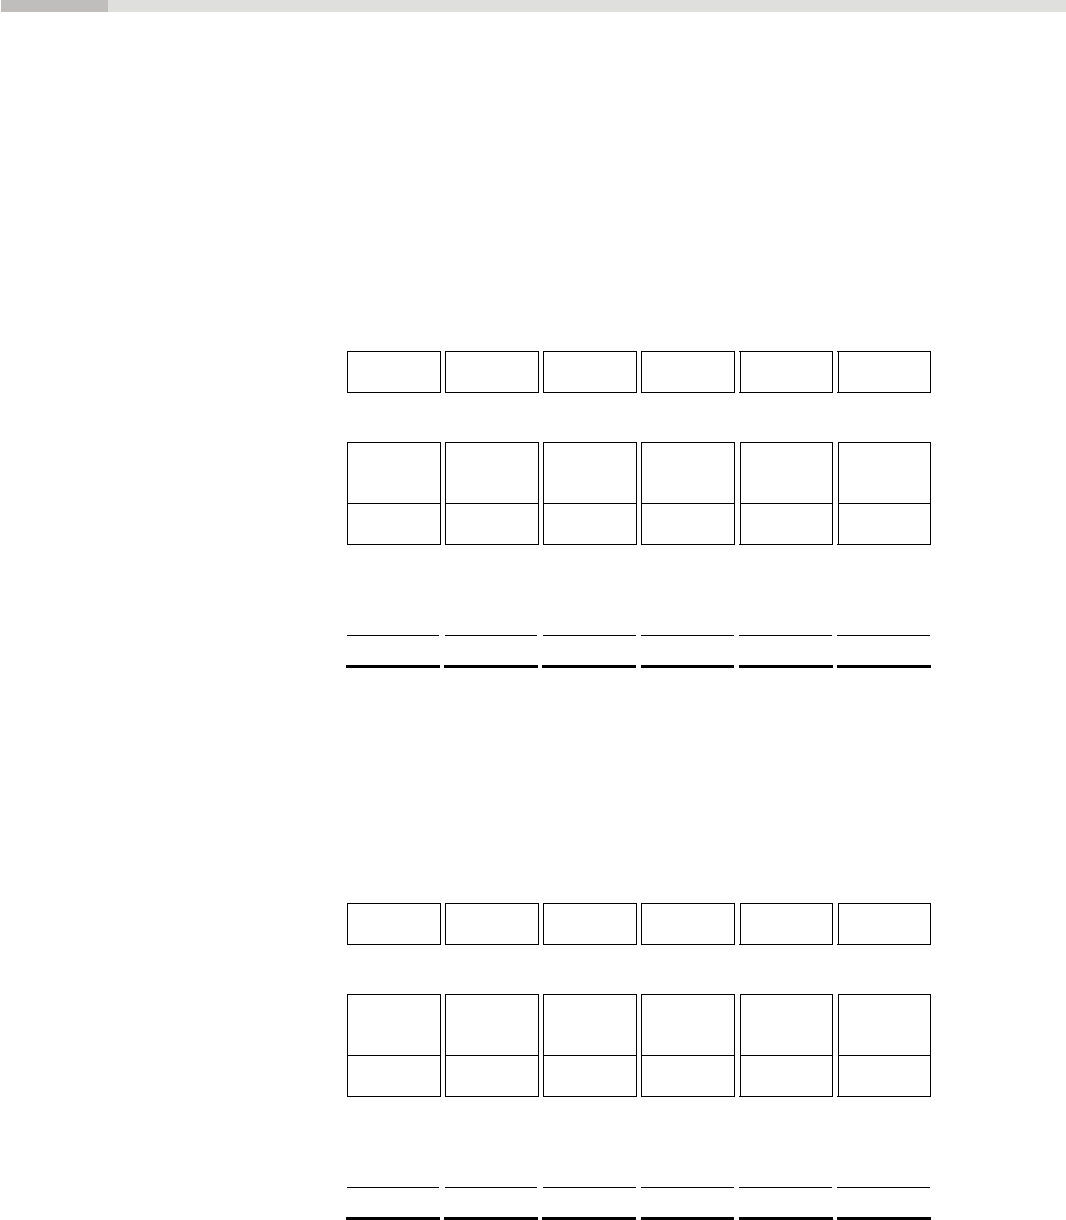
Year to 31 December 2006
Australia ............................................................ 76 32 46 – – 154
India .................................................................. (24) 46 277 2 92 393
Indonesia ........................................................... (22) 46 69 – (22) 71
Japan ................................................................. (3) (2) 49 (1) 80 123
Mainland China ................................................ 276 241 167 – 24 708
Associates ..................................................... 274 210 86 – 5 575
Other mainland China .................................. 2 31 81 – 19 133
Malaysia ............................................................ 77 87 99 (1) 12 274
Middle East ....................................................... 235 356 396 2 46 1,035
Egypt ............................................................ 9 41 41 – 20 111
United Arab Emirates ................................... 70 209 145 3 (2) 425
Other Middle East ........................................ 59 67 70 (1) (1) 194
Middle East (excluding Saudi Arabia) ......... 138 317 256 2 17 730
Saudi Arabia ................................................. 97 39 140 – 29 305
Singapore .......................................................... 73 90 145 68 (11) 365
South Korea ...................................................... (55) (20) 115 – 19 59
Taiwan .............................................................. (179) 37 118 – 1 (23)
Other ................................................................. 23 121 168 10 46 368
477 1,034 1,649 80 287 3,527