HSBC 2007 Annual Report Download - page 165
Download and view the complete annual report
Please find page 165 of the 2007 HSBC annual report below. You can navigate through the pages in the report by either clicking on the pages listed below, or by using the keyword search tool below to find specific information within the annual report.-
 1
1 -
2
-
3
-
4
-
5
-
6
-
7
-
8
-
9
-
10
-
11
-
12
-
13
-
14
-
15
-
16
-
17
-
18
-
19
-
20
-
21
-
22
-
23
-
24
-
25
-
26
-
27
-
28
-
29
-
30
-
31
-
32
-
33
-
34
-
35
-
36
-
37
-
38
-
39
-
40
-
41
-
42
-
43
-
44
-
45
-
46
-
47
-
48
-
49
-
50
-
51
-
52
-
53
-
54
-
55
-
56
-
57
-
58
-
59
-
60
-
61
-
62
-
63
-
64
-
65
-
66
-
67
-
68
-
69
-
70
-
71
-
72
-
73
-
74
-
75
-
76
-
77
-
78
-
79
-
80
-
81
-
82
-
83
-
84
-
85
-
86
-
87
-
88
-
89
-
90
-
91
-
92
-
93
-
94
-
95
-
96
-
97
-
98
-
99
-
100
-
101
-
102
-
103
-
104
-
105
-
106
-
107
-
108
-
109
-
110
-
111
-
112
-
113
-
114
-
115
-
116
-
117
-
118
-
119
-
120
-
121
-
122
-
123
-
124
-
125
-
126
-
127
-
128
-
129
-
130
-
131
-
132
-
133
-
134
-
135
-
136
-
137
-
138
-
139
-
140
-
141
-
142
-
143
-
144
-
145
-
146
-
147
-
148
-
149
-
150
-
151
-
152
-
153
-
154
-
 155
155 -
 156
156 -
 157
157 -
 158
158 -
 159
159 -
 160
160 -
 161
161 -
 162
162 -
 163
163 -
 164
164 -
 165
165 -
 166
166 -
 167
167 -
 168
168 -
 169
169 -
 170
170 -
 171
171 -
 172
172 -
 173
173 -
 174
174 -
 175
175 -
176
-
177
-
178
-
179
-
180
-
181
-
182
-
183
-
184
-
185
-
186
-
187
-
188
-
189
-
190
-
191
-
192
-
193
-
194
-
195
-
196
-
197
-
198
-
199
-
200
-
201
-
202
-
203
-
204
-
205
-
206
-
207
-
208
-
209
-
210
-
211
-
212
-
213
-
214
-
215
-
216
-
217
-
218
-
219
-
220
-
221
-
222
-
223
-
224
-
225
-
226
-
227
-
228
-
229
-
230
-
231
-
232
-
233
-
234
-
235
-
236
-
237
-
238
-
239
-
240
-
241
-
242
-
243
-
244
-
245
-
246
-
247
-
248
-
249
-
250
-
251
-
252
-
253
-
254
-
255
-
256
-
257
-
258
-
259
-
260
-
261
-
262
-
263
-
264
-
265
-
266
-
267
-
268
-
269
-
270
-
271
-
272
-
273
-
274
-
275
-
276
-
277
-
278
-
279
-
280
-
281
-
282
-
283
-
284
-
285
-
286
-
287
-
288
-
289
-
290
-
291
-
292
-
293
-
294
-
295
-
296
-
297
-
298
-
299
-
300
-
301
-
302
-
303
-
304
-
305
-
306
-
307
-
308
-
309
-
310
-
311
-
312
-
313
-
314
-
315
-
316
-
317
-
318
-
319
-
320
-
321
-
322
-
323
-
324
-
325
-
326
-
327
-
328
-
329
-
330
-
331
-
332
-
333
-
334
-
335
-
336
-
337
-
338
-
339
-
340
-
341
-
342
-
343
-
344
-
345
-
346
-
347
-
348
-
349
-
350
-
351
-
352
-
353
-
354
-
355
-
356
-
357
-
358
-
359
-
360
-
361
-
362
-
363
-
364
-
365
-
366
-
367
-
368
-
369
-
370
-
371
-
372
-
373
-
374
-
375
-
376
-
377
-
378
-
379
-
380
-
381
-
382
-
383
-
384
-
385
-
386
-
387
-
388
-
389
-
390
-
391
-
392
-
393
-
394
-
395
-
396
-
397
-
398
-
399
-
400
-
401
-
402
-
403
-
404
-
405
-
406
-
407
-
408
-
409
-
410
-
411
-
412
-
413
-
414
-
415
-
416
-
417
-
418
-
419
-
420
-
421
-
422
-
423
-
424
-
425
-
426
-
427
-
428
-
429
-
430
-
431
-
432
-
433
-
434
-
435
-
436
-
437
-
438
-
439
-
440
-
441
-
442
-
443
-
444
-
445
-
446
-
447
-
448
-
449
-
450
-
451
-
452
-
453
-
454
-
455
-
456
-
457
-
458
-
459
-
460
-
461
-
462
-
463
-
464
-
465
-
466
-
467
-
468
-
469
-
470
-
471
-
472
-
473
-
474
-
475
-
476
 |
 |

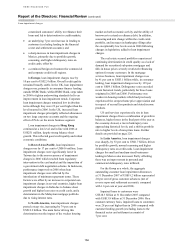
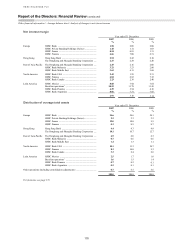
163
31 December 2006. At constant exchange rates,
growth was 19 per cent.
Economic profit
HSBC’s internal performance measures include
economic profit, a calculation which compares the
return on financial capital invested in HSBC by its
shareholders with the cost of that capital. HSBC
prices its cost of capital internally and the difference
between that cost and profit attributable to ordinary
shareholders of the parent company, represents the
amount of economic profit generated. Economic
profit is used by management as a means of deciding
where to allocate resources so that they will be most
productive.
In order to concentrate on external factors rather
than measurement bases, HSBC emphasises the trend
in economic profit within business units rather than
absolute amounts. In light of the current levels of
world interest rates, and taking into account its
geographical and customer group diversification,
HSBC believes that its true cost of capital on a
consolidated basis remains 10 per cent. HSBC plans
to continue using this rate until the end of the current
five-year strategic plan in 2008 in order to ensure
consistency and comparability.
Economic profit increased by US$1.4 billion, or
27 per cent compared with 2006. This increase
compared favourably with the decrease recorded in
2006. Growth in Asia was partially offset by loan
impairment charges, mainly in the US business. This
led to a geographical realignment of profitability
which had a positive effect on economic profit as,
in general, Asia has lower tax rates than the US.
Economic profit was also affected by significant fair
value movements on HSBC’s own debt as a result of
widening credit spreads and related derivatives. This
resulted in a higher return on average invested capital
and, in consequence, economic spread, which
increased by 0.4 percentage points compared
with 2006.
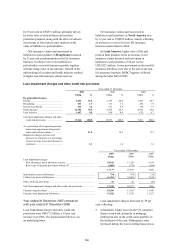
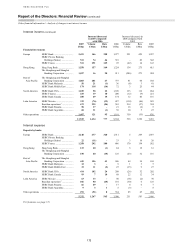
Year ended 31 December
2007 2006
US$m %1 US$m %1
Average total shareholders’ equity ......................................................... 120,346 100,860
Adjusted by:
Goodwill previously amortised or written off ................................... 8,172 8,172
Property revaluation reserves ............................................................. (898) (1,062)
Reserves representing unrealised (gains)/losses on
effective cash flow hedges ............................................................. 425 (126)
Reserves representing unrealised gains on
available-for-sale securities ........................................................... (1,918) (1,156)
Preference shares ................................................................................ (1,405) (1,405)
Average invested capital2 ....................................................................... 124,722 105,283
Return on invested capital3 ..................................................................... 19,043 15.3 15,699 14.9
Benchmark cost of capital ...................................................................... (12,472) (10.0) (10,528) (10.0)
Economic profit/spread .......................................................................... 6,571 5.3 5,171 4.9
1 Expressed as a percentage of average invested capital.
2 Average invested capital is measured as average total shareholders’ equity after:
– adding back the average balance of goodwill impaired or amortised pre-transition to IFRSs or subsequently written-off, directly to
reserves;
– deducting the average balance of HSBC’s revaluation surplus relating to property held for own use. This reserve was generated when
determining the deemed carrying cost of such properties on transition to IFRSs and will run down over time as the properties are
sold;
– deducting average preference shares issued by HSBC Holdings, and;
– deducting average reserves for unrealised gains/(losses) on effective cash flow hedges and available-for-sale securities.
3 Return on invested capital is based on the profit attributable to ordinary shareholders of the parent company.