HSBC 2007 Annual Report Download - page 211
Download and view the complete annual report
Please find page 211 of the 2007 HSBC annual report below. You can navigate through the pages in the report by either clicking on the pages listed below, or by using the keyword search tool below to find specific information within the annual report.-
 1
1 -
2
-
3
-
4
-
5
-
6
-
7
-
8
-
9
-
10
-
11
-
12
-
13
-
14
-
15
-
16
-
17
-
18
-
19
-
20
-
21
-
22
-
23
-
24
-
25
-
26
-
27
-
28
-
29
-
30
-
31
-
32
-
33
-
34
-
35
-
36
-
37
-
38
-
39
-
40
-
41
-
42
-
43
-
44
-
45
-
46
-
47
-
48
-
49
-
50
-
51
-
52
-
53
-
54
-
55
-
56
-
57
-
58
-
59
-
60
-
61
-
62
-
63
-
64
-
65
-
66
-
67
-
68
-
69
-
70
-
71
-
72
-
73
-
74
-
75
-
76
-
77
-
78
-
79
-
80
-
81
-
82
-
83
-
84
-
85
-
86
-
87
-
88
-
89
-
90
-
91
-
92
-
93
-
94
-
95
-
96
-
97
-
98
-
99
-
100
-
101
-
102
-
103
-
104
-
105
-
106
-
107
-
108
-
109
-
110
-
111
-
112
-
113
-
114
-
115
-
116
-
117
-
118
-
119
-
120
-
121
-
122
-
123
-
124
-
125
-
126
-
127
-
128
-
129
-
130
-
131
-
132
-
133
-
134
-
135
-
136
-
137
-
138
-
139
-
140
-
141
-
142
-
143
-
144
-
145
-
146
-
147
-
148
-
149
-
150
-
151
-
152
-
153
-
154
-
155
-
156
-
157
-
158
-
159
-
160
-
161
-
162
-
163
-
164
-
165
-
166
-
167
-
168
-
169
-
170
-
171
-
172
-
173
-
174
-
175
-
176
-
177
-
178
-
179
-
180
-
181
-
182
-
183
-
184
-
185
-
186
-
187
-
188
-
189
-
190
-
191
-
192
-
193
-
194
-
195
-
196
-
197
-
198
-
199
-
200
-
 201
201 -
 202
202 -
 203
203 -
 204
204 -
 205
205 -
 206
206 -
 207
207 -
 208
208 -
 209
209 -
 210
210 -
 211
211 -
 212
212 -
 213
213 -
 214
214 -
 215
215 -
 216
216 -
 217
217 -
 218
218 -
 219
219 -
 220
220 -
 221
221 -
222
-
223
-
224
-
225
-
226
-
227
-
228
-
229
-
230
-
231
-
232
-
233
-
234
-
235
-
236
-
237
-
238
-
239
-
240
-
241
-
242
-
243
-
244
-
245
-
246
-
247
-
248
-
249
-
250
-
251
-
252
-
253
-
254
-
255
-
256
-
257
-
258
-
259
-
260
-
261
-
262
-
263
-
264
-
265
-
266
-
267
-
268
-
269
-
270
-
271
-
272
-
273
-
274
-
275
-
276
-
277
-
278
-
279
-
280
-
281
-
282
-
283
-
284
-
285
-
286
-
287
-
288
-
289
-
290
-
291
-
292
-
293
-
294
-
295
-
296
-
297
-
298
-
299
-
300
-
301
-
302
-
303
-
304
-
305
-
306
-
307
-
308
-
309
-
310
-
311
-
312
-
313
-
314
-
315
-
316
-
317
-
318
-
319
-
320
-
321
-
322
-
323
-
324
-
325
-
326
-
327
-
328
-
329
-
330
-
331
-
332
-
333
-
334
-
335
-
336
-
337
-
338
-
339
-
340
-
341
-
342
-
343
-
344
-
345
-
346
-
347
-
348
-
349
-
350
-
351
-
352
-
353
-
354
-
355
-
356
-
357
-
358
-
359
-
360
-
361
-
362
-
363
-
364
-
365
-
366
-
367
-
368
-
369
-
370
-
371
-
372
-
373
-
374
-
375
-
376
-
377
-
378
-
379
-
380
-
381
-
382
-
383
-
384
-
385
-
386
-
387
-
388
-
389
-
390
-
391
-
392
-
393
-
394
-
395
-
396
-
397
-
398
-
399
-
400
-
401
-
402
-
403
-
404
-
405
-
406
-
407
-
408
-
409
-
410
-
411
-
412
-
413
-
414
-
415
-
416
-
417
-
418
-
419
-
420
-
421
-
422
-
423
-
424
-
425
-
426
-
427
-
428
-
429
-
430
-
431
-
432
-
433
-
434
-
435
-
436
-
437
-
438
-
439
-
440
-
441
-
442
-
443
-
444
-
445
-
446
-
447
-
448
-
449
-
450
-
451
-
452
-
453
-
454
-
455
-
456
-
457
-
458
-
459
-
460
-
461
-
462
-
463
-
464
-
465
-
466
-
467
-
468
-
469
-
470
-
471
-
472
-
473
-
474
-
475
-
476
 |
 |

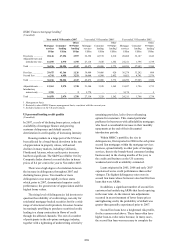
209
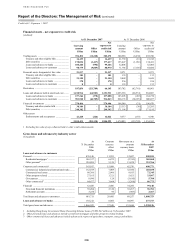
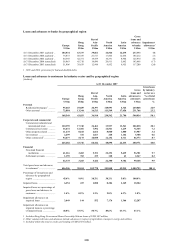
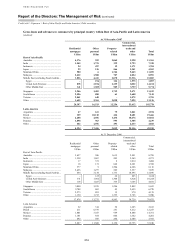
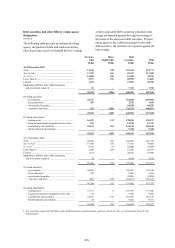
Loans and advances to banks by geographical region
Europe
Hong
Kong
Rest of
Asia-
Pacific
North
America
Latin
America
Gross
loans and
advances
to banks
Impairment
allowances1
US$m US$m US$m US$m US$m US$m US$m
At 31 December 2007 (audited) .. 104,534 63,737 39,861 16,566 12,675 237,373 (7)
At 31 December 2006 (audited) .. 76,837 50,359 27,517 17,865 12,634 185,212 (7)
At 31 December 2005 (audited) .. 44,369 42,751 19,559 10,331 8,964 125,974 (9)
At 31 December 2004 (unaudited) 56,063 45,710 14,890 20,911 5,892 143,466 (17)
At 31 December 2003 (unaudited) 51,806 38,639 12,948 6,852 6,955 117,200 (24)
1 2003 and 2004: provisions for bad and doubtful debts.
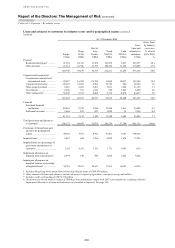
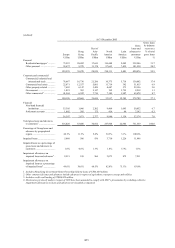
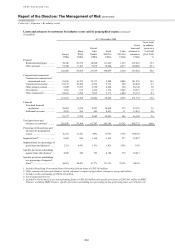
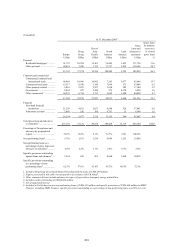
Loans and advances to customers by industry sector and by geographical region
(Audited)
At 31 December 2007
Europe
Hong
Kong
Rest of
Asia-
Pacific
North
America
Latin
America
Gross
loans and
advances to
customers
Gross loans
by industry
sector as a
% of total
gross loans
US$m US$m US$m US$m US$m US$m %
Personal
Residential mortgages1 ............ 95,665 29,689 20,397 118,993 4,324 269,068 26.9
Other personal ......................... 72,884 13,344 16,513 111,569 17,456 231,766 23.2
168,549 43,033 36,910 230,562 21,780 500,834 50.1
Corporate and commercial
Commercial, industrial and
international trade ............... 120,359 17,740 36,461 13,937 13,541 202,038 20.1
Commercial real estate ............ 36,672 12,301 7,592 14,561 1,219 72,345 7.2
Other property-related ............. 11,275 8,168 4,664 8,000 1,800 33,907 3.4
Government ............................. 2,299 332 1,667 248 1,162 5,708 0.6
Other commercial2 ................... 54,677 5,175 10,058 12,152 4,711 86,773 8.7
225,282 43,716 60,442 48,898 22,433 400,771 40.0
Financial
Non-bank financial
institutions ........................... 61,216 2,483 5,191 22,252 5,639 96,781 9.7
Settlement accounts ................. 1,159 782 235 128 63 2,367 0.2
62,375 3,265 5,426 22,380 5,702 99,148 9.9
Total gross loans and advances
to customers3............................ 456,206 90,014 102,778 301,840 49,915 1,000,753 100 .0
Percentage of Group loans and
advances by geographical
region ....................................... 45.6% 9.0% 10.2% 30.2% 5.0% 100.0%
Impaired loans ............................. 6,254 433 1,088 8,384 2,145 18,304
Impaired loans as a percentage of
gross loans and advances to
customers ................................. 1.4% 0.5% 1.1% 2.8% 4.3% 1.8%
Impairment allowances on
impaired loans ......................... 3,049 144 552 7,176 1,366 12,287
Impairment allowances on
impaired loans as a percentage
of impaired loans ..................... 48.8% 33.3% 50.7% 85.6% 63.7% 67.1%
1 Includes Hong Kong Government Home Ownership Scheme loans of US$3,942 million.
2 Other commercial loans and advances include advances in respect of agriculture, transport, energy and utilities.
3 Included within this total is credit card lending of US$82,854 million.