HSBC 2007 Annual Report Download - page 371
Download and view the complete annual report
Please find page 371 of the 2007 HSBC annual report below. You can navigate through the pages in the report by either clicking on the pages listed below, or by using the keyword search tool below to find specific information within the annual report.-
 1
1 -
2
-
3
-
4
-
5
-
6
-
7
-
8
-
9
-
10
-
11
-
12
-
13
-
14
-
15
-
16
-
17
-
18
-
19
-
20
-
21
-
22
-
23
-
24
-
25
-
26
-
27
-
28
-
29
-
30
-
31
-
32
-
33
-
34
-
35
-
36
-
37
-
38
-
39
-
40
-
41
-
42
-
43
-
44
-
45
-
46
-
47
-
48
-
49
-
50
-
51
-
52
-
53
-
54
-
55
-
56
-
57
-
58
-
59
-
60
-
61
-
62
-
63
-
64
-
65
-
66
-
67
-
68
-
69
-
70
-
71
-
72
-
73
-
74
-
75
-
76
-
77
-
78
-
79
-
80
-
81
-
82
-
83
-
84
-
85
-
86
-
87
-
88
-
89
-
90
-
91
-
92
-
93
-
94
-
95
-
96
-
97
-
98
-
99
-
100
-
101
-
102
-
103
-
104
-
105
-
106
-
107
-
108
-
109
-
110
-
111
-
112
-
113
-
114
-
115
-
116
-
117
-
118
-
119
-
120
-
121
-
122
-
123
-
124
-
125
-
126
-
127
-
128
-
129
-
130
-
131
-
132
-
133
-
134
-
135
-
136
-
137
-
138
-
139
-
140
-
141
-
142
-
143
-
144
-
145
-
146
-
147
-
148
-
149
-
150
-
151
-
152
-
153
-
154
-
155
-
156
-
157
-
158
-
159
-
160
-
161
-
162
-
163
-
164
-
165
-
166
-
167
-
168
-
169
-
170
-
171
-
172
-
173
-
174
-
175
-
176
-
177
-
178
-
179
-
180
-
181
-
182
-
183
-
184
-
185
-
186
-
187
-
188
-
189
-
190
-
191
-
192
-
193
-
194
-
195
-
196
-
197
-
198
-
199
-
200
-
201
-
202
-
203
-
204
-
205
-
206
-
207
-
208
-
209
-
210
-
211
-
212
-
213
-
214
-
215
-
216
-
217
-
218
-
219
-
220
-
221
-
222
-
223
-
224
-
225
-
226
-
227
-
228
-
229
-
230
-
231
-
232
-
233
-
234
-
235
-
236
-
237
-
238
-
239
-
240
-
241
-
242
-
243
-
244
-
245
-
246
-
247
-
248
-
249
-
250
-
251
-
252
-
253
-
254
-
255
-
256
-
257
-
258
-
259
-
260
-
261
-
262
-
263
-
264
-
265
-
266
-
267
-
268
-
269
-
270
-
271
-
272
-
273
-
274
-
275
-
276
-
277
-
278
-
279
-
280
-
281
-
282
-
283
-
284
-
285
-
286
-
287
-
288
-
289
-
290
-
291
-
292
-
293
-
294
-
295
-
296
-
297
-
298
-
299
-
300
-
301
-
302
-
303
-
304
-
305
-
306
-
307
-
308
-
309
-
310
-
311
-
312
-
313
-
314
-
315
-
316
-
317
-
318
-
319
-
320
-
321
-
322
-
323
-
324
-
325
-
326
-
327
-
328
-
329
-
330
-
331
-
332
-
333
-
334
-
335
-
336
-
337
-
338
-
339
-
340
-
341
-
342
-
343
-
344
-
345
-
346
-
347
-
348
-
349
-
350
-
351
-
352
-
353
-
354
-
355
-
356
-
357
-
358
-
359
-
360
-
 361
361 -
 362
362 -
 363
363 -
 364
364 -
 365
365 -
 366
366 -
 367
367 -
 368
368 -
 369
369 -
 370
370 -
 371
371 -
 372
372 -
 373
373 -
 374
374 -
 375
375 -
 376
376 -
 377
377 -
 378
378 -
 379
379 -
 380
380 -
 381
381 -
382
-
383
-
384
-
385
-
386
-
387
-
388
-
389
-
390
-
391
-
392
-
393
-
394
-
395
-
396
-
397
-
398
-
399
-
400
-
401
-
402
-
403
-
404
-
405
-
406
-
407
-
408
-
409
-
410
-
411
-
412
-
413
-
414
-
415
-
416
-
417
-
418
-
419
-
420
-
421
-
422
-
423
-
424
-
425
-
426
-
427
-
428
-
429
-
430
-
431
-
432
-
433
-
434
-
435
-
436
-
437
-
438
-
439
-
440
-
441
-
442
-
443
-
444
-
445
-
446
-
447
-
448
-
449
-
450
-
451
-
452
-
453
-
454
-
455
-
456
-
457
-
458
-
459
-
460
-
461
-
462
-
463
-
464
-
465
-
466
-
467
-
468
-
469
-
470
-
471
-
472
-
473
-
474
-
475
-
476
 |
 |

369
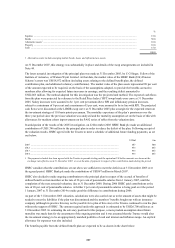
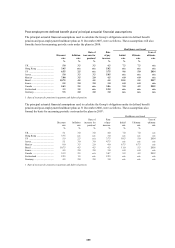
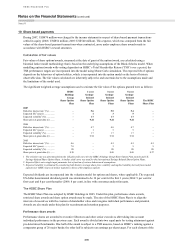
Post-employment defined benefit plans’ principal actuarial financial assumptions
The principal actuarial financial assumptions used to calculate the Group’s obligations under its defined benefit
pension and post-employment healthcare plans at 31 December 2007, were as follows. These assumptions will also
form the basis for measuring periodic costs under the plans in 2008:
Healthcare cost trend
Discount
rate
Inflation
rate
Rate of
increase for
pensions1
Rate
of pay
increase
Initial
rate
Ultimate
rate
Year of
ultimate
rate
% % % % % %
UK .........................................
.
5.8 3.3 3.3 4.3 7.3 7.3 n/a
Hong Kong ............................
.
3.45 n/a n/a 5.02 n/a n/a n/a
US .........................................
.
6.55 2.5 n/a 3.75 9.6 5.0 2014
Jersey .....................................
.
5.8 3.3 3.3 5.05 n/a n/a n/a
Mexico ..................................
.
7.88 3.5 2.0 4.5 6.0 6.0 n/a
Brazil .....................................
.
10.75 4.5 4.5 4.5 10.5 5.5 2017
France ....................................
.
5.5 2.0 2.0 3.0 6.0 6.0 n/a
Canada ..................................
.
5.43 2.5 n/a 3.86 9.0 4.9 2012
Switzerland ...........................
.
3.3 1.5 n/a 2.38 n/a n/a n/a
Germany ................................
.
5.5 2.0 2.0 3.0 n/a n/a n/a
1 Rate of increase for pensions in payment and deferred pension.
The principal actuarial financial assumptions used to calculate the Group’s obligations under its defined benefit
pension and post-employment healthcare plans at 31 December 2006, were as follows. These assumptions also
formed the basis for measuring periodic costs under the plans in 2007:
Healthcare cost trend
Discount
rate
Inflation
rate
Rate of
increase for
pensions1
Rate
of pay
increase
Initial
rate
Ultimate
rate
Year of
ultimate
rate
% % % % % %
UK .........................................
.
5.1 3.0 3.0 4.0 7.0 7.0 n/a
Hong Kong ............................
.
3.75 n/a n/a 3.0 n/a n/a n/a
US .........................................
.
5.9 2.5 n/a 3.75 10.5 5.0 2014
Jersey .....................................
.
5.1 3.0 3.0 4.75 n/a n/a n/a
Mexico ..................................
.
8.0 3.5 2.0 4.0 6.75 6.75 n/a
Brazil .....................................
.
10.75 4.5 4.5 4.5 11.0 5.5 2016
France ....................................
.
4.5 2.0 2.0 3.0 6.0 6.0 n/a
Canada ..................................
.
5.19 2.5 n/a 3.47 9.9 4.9 2012
Switzerland ...........................
.
2.25 1.5 n/a 2.25 n/a n/a n/a
Germany ................................
.
4.5 2.0 2.0 3.0 n/a n/a n/a
1 Rate of increase for pensions in payment and deferred pension.