HSBC 2007 Annual Report Download - page 36
Download and view the complete annual report
Please find page 36 of the 2007 HSBC annual report below. You can navigate through the pages in the report by either clicking on the pages listed below, or by using the keyword search tool below to find specific information within the annual report.-
 1
1 -
2
-
3
-
4
-
5
-
6
-
7
-
8
-
9
-
10
-
11
-
12
-
13
-
14
-
15
-
16
-
17
-
18
-
19
-
20
-
21
-
22
-
23
-
24
-
25
-
 26
26 -
 27
27 -
 28
28 -
 29
29 -
 30
30 -
 31
31 -
 32
32 -
 33
33 -
 34
34 -
 35
35 -
 36
36 -
 37
37 -
 38
38 -
 39
39 -
 40
40 -
 41
41 -
 42
42 -
 43
43 -
 44
44 -
 45
45 -
 46
46 -
47
-
48
-
49
-
50
-
51
-
52
-
53
-
54
-
55
-
56
-
57
-
58
-
59
-
60
-
61
-
62
-
63
-
64
-
65
-
66
-
67
-
68
-
69
-
70
-
71
-
72
-
73
-
74
-
75
-
76
-
77
-
78
-
79
-
80
-
81
-
82
-
83
-
84
-
85
-
86
-
87
-
88
-
89
-
90
-
91
-
92
-
93
-
94
-
95
-
96
-
97
-
98
-
99
-
100
-
101
-
102
-
103
-
104
-
105
-
106
-
107
-
108
-
109
-
110
-
111
-
112
-
113
-
114
-
115
-
116
-
117
-
118
-
119
-
120
-
121
-
122
-
123
-
124
-
125
-
126
-
127
-
128
-
129
-
130
-
131
-
132
-
133
-
134
-
135
-
136
-
137
-
138
-
139
-
140
-
141
-
142
-
143
-
144
-
145
-
146
-
147
-
148
-
149
-
150
-
151
-
152
-
153
-
154
-
155
-
156
-
157
-
158
-
159
-
160
-
161
-
162
-
163
-
164
-
165
-
166
-
167
-
168
-
169
-
170
-
171
-
172
-
173
-
174
-
175
-
176
-
177
-
178
-
179
-
180
-
181
-
182
-
183
-
184
-
185
-
186
-
187
-
188
-
189
-
190
-
191
-
192
-
193
-
194
-
195
-
196
-
197
-
198
-
199
-
200
-
201
-
202
-
203
-
204
-
205
-
206
-
207
-
208
-
209
-
210
-
211
-
212
-
213
-
214
-
215
-
216
-
217
-
218
-
219
-
220
-
221
-
222
-
223
-
224
-
225
-
226
-
227
-
228
-
229
-
230
-
231
-
232
-
233
-
234
-
235
-
236
-
237
-
238
-
239
-
240
-
241
-
242
-
243
-
244
-
245
-
246
-
247
-
248
-
249
-
250
-
251
-
252
-
253
-
254
-
255
-
256
-
257
-
258
-
259
-
260
-
261
-
262
-
263
-
264
-
265
-
266
-
267
-
268
-
269
-
270
-
271
-
272
-
273
-
274
-
275
-
276
-
277
-
278
-
279
-
280
-
281
-
282
-
283
-
284
-
285
-
286
-
287
-
288
-
289
-
290
-
291
-
292
-
293
-
294
-
295
-
296
-
297
-
298
-
299
-
300
-
301
-
302
-
303
-
304
-
305
-
306
-
307
-
308
-
309
-
310
-
311
-
312
-
313
-
314
-
315
-
316
-
317
-
318
-
319
-
320
-
321
-
322
-
323
-
324
-
325
-
326
-
327
-
328
-
329
-
330
-
331
-
332
-
333
-
334
-
335
-
336
-
337
-
338
-
339
-
340
-
341
-
342
-
343
-
344
-
345
-
346
-
347
-
348
-
349
-
350
-
351
-
352
-
353
-
354
-
355
-
356
-
357
-
358
-
359
-
360
-
361
-
362
-
363
-
364
-
365
-
366
-
367
-
368
-
369
-
370
-
371
-
372
-
373
-
374
-
375
-
376
-
377
-
378
-
379
-
380
-
381
-
382
-
383
-
384
-
385
-
386
-
387
-
388
-
389
-
390
-
391
-
392
-
393
-
394
-
395
-
396
-
397
-
398
-
399
-
400
-
401
-
402
-
403
-
404
-
405
-
406
-
407
-
408
-
409
-
410
-
411
-
412
-
413
-
414
-
415
-
416
-
417
-
418
-
419
-
420
-
421
-
422
-
423
-
424
-
425
-
426
-
427
-
428
-
429
-
430
-
431
-
432
-
433
-
434
-
435
-
436
-
437
-
438
-
439
-
440
-
441
-
442
-
443
-
444
-
445
-
446
-
447
-
448
-
449
-
450
-
451
-
452
-
453
-
454
-
455
-
456
-
457
-
458
-
459
-
460
-
461
-
462
-
463
-
464
-
465
-
466
-
467
-
468
-
469
-
470
-
471
-
472
-
473
-
474
-
475
-
476
 |
 |

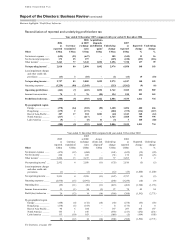
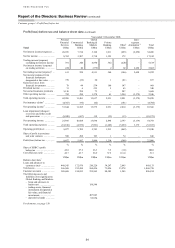
HSBC HOLDINGS PLC
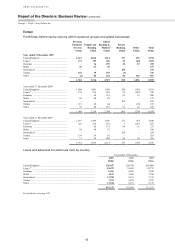
Report of the Directors: Business Review (continued)
Customer groups > Profit/(loss) before tax
34
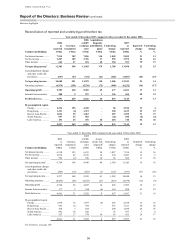
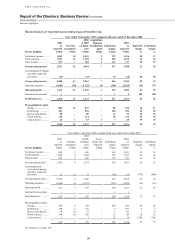
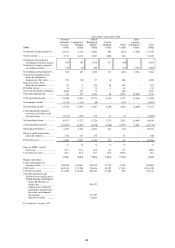
Profit/(loss) before tax and balance sheet data (continued)
Year ended 31 December 2006
Total
Personal
Financial
Services
US$m
Commercial
Banking
US$m
Global
Banking &
Markets
US$m
Private
Banking
US$m
Other8
US$m
Inter-
segment
elimination14
US$m
Total
US$m
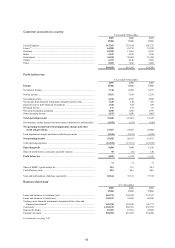
Net interest income/(expense) .... 26,076 7,514 3,168 1,011 (625) (2,658) 34,486
Net fee income ............................ 8,762 3,207 3,718 1,323 172 – 17,182
Trading income/(expense)
excluding net interest income 391 204 4,890 362 (228) – 5,619
Net interest income/ (expense)
on trading activities ................ 220 20 (379) 2 82 2,658 2,603
Net trading income/(expense)5 ... 611 224 4,511 364 (146) 2,658 8,222
Net income/(expense) from
financial instruments
designated at fair value ........... 739 (22) 20 1 (81) – 657
Gains less losses from
financial investments .............. 78 44 534 166 147 – 969
Dividend income ......................... 31 6 235 5 63 – 340
Net earned insurance premiums . 5,130 258 73 – 207 – 5,668
Other operating income .............. 782 250 1,378 61 3,254 (3,179) 2,546
Total operating income ............... 42,209 11,481 13,637 2,931 2,991 (3,179) 70,070
Net insurance claims6 ................. (4,365) (96) (62) – (181) – (4,704)
Net operating income4 ................ 37,844 11,385 13,575 2,931 2,810 (3,179) 65,366
Loan impairment (charges)/
recoveries and other credit
risk provisions ........................ (9,949) (697) 119 (33) (13) – (10,573)
Net operating income ................. 27,895 10,688 13,694 2,898 2,797 (3,179) 54,793
Total operating expenses ............ (18,818) (4,979) (7,991) (1,685) (3,259) 3,179 (33,553)
Operating profit/(loss) ................ 9,077 5,709 5,703 1,213 (462) – 21,240
Share of profit in associates
and joint ventures ................... 380 288 103 1 74 – 846
Profit/(loss) before tax ................ 9,457 5,997 5,806 1,214 (388) – 22,086
% % % % % %
Share of HSBC’s profit
before tax ................................ 42.8 27.2 26.3 5.5 (1.8) 100.0
Cost efficiency ratio ................... 49.7 43.7 58.9 57.5 116.0 51.3
US$m US$m US$m US$m US$m US$m
Balance sheet data7
Loans and advances to
customers (net) ....................... 448,545 172,976 210,220 34,297 2,095 868,133
Total assets .................................. 546,568 213,450 994,436 73,026 33,278 1,860,758
Customer accounts ...................... 388,468 190,853 235,965 80,303 1,245 896,834
The following assets and
liabilities were significant to
Global Banking and Markets:
– loans and advances to
banks (net) .......................... 156,548
– trading assets, financial
instruments designated at
fair value, and financial
investments ......................... 487,943
– deposits by banks ............... 92,954
For footnotes, see page 130.