HSBC 2007 Annual Report Download - page 146
Download and view the complete annual report
Please find page 146 of the 2007 HSBC annual report below. You can navigate through the pages in the report by either clicking on the pages listed below, or by using the keyword search tool below to find specific information within the annual report.-
 1
1 -
2
-
3
-
4
-
5
-
6
-
7
-
8
-
9
-
10
-
11
-
12
-
13
-
14
-
15
-
16
-
17
-
18
-
19
-
20
-
21
-
22
-
23
-
24
-
25
-
26
-
27
-
28
-
29
-
30
-
31
-
32
-
33
-
34
-
35
-
36
-
37
-
38
-
39
-
40
-
41
-
42
-
43
-
44
-
45
-
46
-
47
-
48
-
49
-
50
-
51
-
52
-
53
-
54
-
55
-
56
-
57
-
58
-
59
-
60
-
61
-
62
-
63
-
64
-
65
-
66
-
67
-
68
-
69
-
70
-
71
-
72
-
73
-
74
-
75
-
76
-
77
-
78
-
79
-
80
-
81
-
82
-
83
-
84
-
85
-
86
-
87
-
88
-
89
-
90
-
91
-
92
-
93
-
94
-
95
-
96
-
97
-
98
-
99
-
100
-
101
-
102
-
103
-
104
-
105
-
106
-
107
-
108
-
109
-
110
-
111
-
112
-
113
-
114
-
115
-
116
-
117
-
118
-
119
-
120
-
121
-
122
-
123
-
124
-
125
-
126
-
127
-
128
-
129
-
130
-
131
-
132
-
133
-
134
-
135
-
 136
136 -
 137
137 -
 138
138 -
 139
139 -
 140
140 -
 141
141 -
 142
142 -
 143
143 -
 144
144 -
 145
145 -
 146
146 -
 147
147 -
 148
148 -
 149
149 -
 150
150 -
 151
151 -
 152
152 -
 153
153 -
 154
154 -
 155
155 -
 156
156 -
157
-
158
-
159
-
160
-
161
-
162
-
163
-
164
-
165
-
166
-
167
-
168
-
169
-
170
-
171
-
172
-
173
-
174
-
175
-
176
-
177
-
178
-
179
-
180
-
181
-
182
-
183
-
184
-
185
-
186
-
187
-
188
-
189
-
190
-
191
-
192
-
193
-
194
-
195
-
196
-
197
-
198
-
199
-
200
-
201
-
202
-
203
-
204
-
205
-
206
-
207
-
208
-
209
-
210
-
211
-
212
-
213
-
214
-
215
-
216
-
217
-
218
-
219
-
220
-
221
-
222
-
223
-
224
-
225
-
226
-
227
-
228
-
229
-
230
-
231
-
232
-
233
-
234
-
235
-
236
-
237
-
238
-
239
-
240
-
241
-
242
-
243
-
244
-
245
-
246
-
247
-
248
-
249
-
250
-
251
-
252
-
253
-
254
-
255
-
256
-
257
-
258
-
259
-
260
-
261
-
262
-
263
-
264
-
265
-
266
-
267
-
268
-
269
-
270
-
271
-
272
-
273
-
274
-
275
-
276
-
277
-
278
-
279
-
280
-
281
-
282
-
283
-
284
-
285
-
286
-
287
-
288
-
289
-
290
-
291
-
292
-
293
-
294
-
295
-
296
-
297
-
298
-
299
-
300
-
301
-
302
-
303
-
304
-
305
-
306
-
307
-
308
-
309
-
310
-
311
-
312
-
313
-
314
-
315
-
316
-
317
-
318
-
319
-
320
-
321
-
322
-
323
-
324
-
325
-
326
-
327
-
328
-
329
-
330
-
331
-
332
-
333
-
334
-
335
-
336
-
337
-
338
-
339
-
340
-
341
-
342
-
343
-
344
-
345
-
346
-
347
-
348
-
349
-
350
-
351
-
352
-
353
-
354
-
355
-
356
-
357
-
358
-
359
-
360
-
361
-
362
-
363
-
364
-
365
-
366
-
367
-
368
-
369
-
370
-
371
-
372
-
373
-
374
-
375
-
376
-
377
-
378
-
379
-
380
-
381
-
382
-
383
-
384
-
385
-
386
-
387
-
388
-
389
-
390
-
391
-
392
-
393
-
394
-
395
-
396
-
397
-
398
-
399
-
400
-
401
-
402
-
403
-
404
-
405
-
406
-
407
-
408
-
409
-
410
-
411
-
412
-
413
-
414
-
415
-
416
-
417
-
418
-
419
-
420
-
421
-
422
-
423
-
424
-
425
-
426
-
427
-
428
-
429
-
430
-
431
-
432
-
433
-
434
-
435
-
436
-
437
-
438
-
439
-
440
-
441
-
442
-
443
-
444
-
445
-
446
-
447
-
448
-
449
-
450
-
451
-
452
-
453
-
454
-
455
-
456
-
457
-
458
-
459
-
460
-
461
-
462
-
463
-
464
-
465
-
466
-
467
-
468
-
469
-
470
-
471
-
472
-
473
-
474
-
475
-
476
 |
 |

HSBC HOLDINGS PLC
Report of the Directors: Financial Review (continued)
Net trading income
144
Increases in 2006 were partly offset by the effect of
FFIEC guidance, which limits certain fee billings for
non-prime credit card accounts. Following its launch
in 2005, activity within HSBC’s mortgage-backed
securities business increased rapidly during 2006. As
a result, a greater proportion of loans originated by
HSBC were sold to the secondary market and
mortgage servicing fees grew accordingly, while
income in the mortgage-backed securities business
also rose. Tariff increases contributed to higher
account service fees. Higher business volumes led to
a rise in taxpayer services fees, while the WTAS
business progressed strongly, expanding its customer
base and reporting significantly higher fee income.
In Latin America, increased cards in circulation
and improvements in activation times led to higher
card issuing fees, while growth in the merchant
customer base led to a rise in card acquiring income.
Account servicing fees benefited from higher
packaged account sales, enhancements to other
current account products, price increases and greater
transaction volumes. The expansion of HSBC’s
ATM network in Mexico drove higher ATM fees.
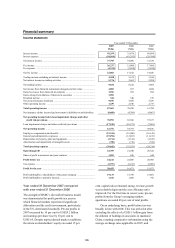
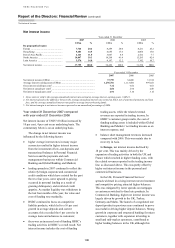
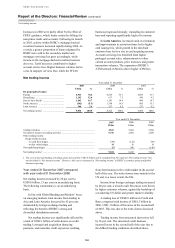
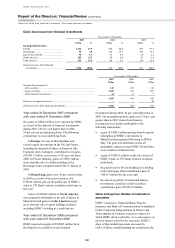
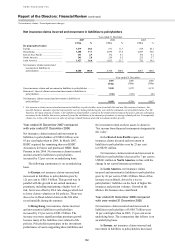
Net trading income
Year ended 31 December
2007 2006 2005
US$m % US$m % US$m %
By geographical region
Europe ......................................................... 6,943 70.6 4,529 55.1 3,036 51.7
Hong Kong ................................................. 1,242 12.6 617 7.5 546 9.3
Rest of Asia-Pacific .................................... 1,643 16.7 1,181 14.4 860 14.7
North America ............................................ (542) (5.5) 1,358 16.5 885 15.1
Latin America ............................................. 548 5.6 537 6.5 537 9.2
Net trading income1 .................................... 9,834 100.0 8,222 100.0 5,864 100.0
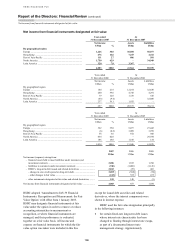
Year ended 31 December
2007
US$m
2006
US$m
2005
US$m
Trading activities ............................................................................................. 4,521 5,465 3,884
Net interest income on trading activities ......................................................... 5,376 2,603 2,208
Other trading income
Hedge ineffectiveness:
– on cash flow hedges ............................................................................... (77) (122) (96)
– on fair value hedges ............................................................................... 19 16 14
Non-qualifying hedges .................................................................................... (5) 260 (146)
Net trading income1 ......................................................................................... 9,834 8,222 5,864
1 The cost of internal funding of trading assets increased by US$2.8 billion and is excluded from the reported ‘Net trading income’ line
and included in ‘Net interest income’. However, this cost is reinstated in ‘Net trading income’ in HSBC’s customer group and global
business reporting.
Year ended 31 December 2007 compared
with year ended 31 December 2006
Net trading income increased by 20 per cent to
US$9.8 billion, 13 per cent on an underlying basis.
The following commentary is on an underlying
basis.
In line with Global Banking and Markets’ focus
on emerging markets, total income from trading in
Asia and Latin America increased by 42 per cent,
dominated by foreign exchange trading and
reflecting the benefit of HSBC’s strong and
diversified distribution network.
Net trading income was significantly affected by
a total of US$2.1 billion of write-downs on credit
trading, leveraged and acquisition financing
positions, and monoline credit exposures resulting
from deterioration in the credit market in the second
half of the year. The write-downs arose mainly in the
US and, to a lesser extent, the UK.
Income from foreign exchange trading increased
by 40 per cent, a record result. Revenues were driven
by higher customer volumes, against the backdrop of
a weakening US dollar and greater market volatility.
A trading loss of US$419 million in Credit and
Rates compared with income of US$1.3 billion in
2006. US$1.1 billion of this arose in the second half
of 2007. This was due to the write-downs discussed
above.
Trading income from structured derivatives fell
by 26 per cent. The structured credit business
incurred losses in the second half of the year due to
the difficult trading conditions described above.