HSBC 2007 Annual Report Download - page 214
Download and view the complete annual report
Please find page 214 of the 2007 HSBC annual report below. You can navigate through the pages in the report by either clicking on the pages listed below, or by using the keyword search tool below to find specific information within the annual report.-
 1
1 -
2
-
3
-
4
-
5
-
6
-
7
-
8
-
9
-
10
-
11
-
12
-
13
-
14
-
15
-
16
-
17
-
18
-
19
-
20
-
21
-
22
-
23
-
24
-
25
-
26
-
27
-
28
-
29
-
30
-
31
-
32
-
33
-
34
-
35
-
36
-
37
-
38
-
39
-
40
-
41
-
42
-
43
-
44
-
45
-
46
-
47
-
48
-
49
-
50
-
51
-
52
-
53
-
54
-
55
-
56
-
57
-
58
-
59
-
60
-
61
-
62
-
63
-
64
-
65
-
66
-
67
-
68
-
69
-
70
-
71
-
72
-
73
-
74
-
75
-
76
-
77
-
78
-
79
-
80
-
81
-
82
-
83
-
84
-
85
-
86
-
87
-
88
-
89
-
90
-
91
-
92
-
93
-
94
-
95
-
96
-
97
-
98
-
99
-
100
-
101
-
102
-
103
-
104
-
105
-
106
-
107
-
108
-
109
-
110
-
111
-
112
-
113
-
114
-
115
-
116
-
117
-
118
-
119
-
120
-
121
-
122
-
123
-
124
-
125
-
126
-
127
-
128
-
129
-
130
-
131
-
132
-
133
-
134
-
135
-
136
-
137
-
138
-
139
-
140
-
141
-
142
-
143
-
144
-
145
-
146
-
147
-
148
-
149
-
150
-
151
-
152
-
153
-
154
-
155
-
156
-
157
-
158
-
159
-
160
-
161
-
162
-
163
-
164
-
165
-
166
-
167
-
168
-
169
-
170
-
171
-
172
-
173
-
174
-
175
-
176
-
177
-
178
-
179
-
180
-
181
-
182
-
183
-
184
-
185
-
186
-
187
-
188
-
189
-
190
-
191
-
192
-
193
-
194
-
195
-
196
-
197
-
198
-
199
-
200
-
201
-
202
-
203
-
 204
204 -
 205
205 -
 206
206 -
 207
207 -
 208
208 -
 209
209 -
 210
210 -
 211
211 -
 212
212 -
 213
213 -
 214
214 -
 215
215 -
 216
216 -
 217
217 -
 218
218 -
 219
219 -
 220
220 -
 221
221 -
 222
222 -
 223
223 -
 224
224 -
225
-
226
-
227
-
228
-
229
-
230
-
231
-
232
-
233
-
234
-
235
-
236
-
237
-
238
-
239
-
240
-
241
-
242
-
243
-
244
-
245
-
246
-
247
-
248
-
249
-
250
-
251
-
252
-
253
-
254
-
255
-
256
-
257
-
258
-
259
-
260
-
261
-
262
-
263
-
264
-
265
-
266
-
267
-
268
-
269
-
270
-
271
-
272
-
273
-
274
-
275
-
276
-
277
-
278
-
279
-
280
-
281
-
282
-
283
-
284
-
285
-
286
-
287
-
288
-
289
-
290
-
291
-
292
-
293
-
294
-
295
-
296
-
297
-
298
-
299
-
300
-
301
-
302
-
303
-
304
-
305
-
306
-
307
-
308
-
309
-
310
-
311
-
312
-
313
-
314
-
315
-
316
-
317
-
318
-
319
-
320
-
321
-
322
-
323
-
324
-
325
-
326
-
327
-
328
-
329
-
330
-
331
-
332
-
333
-
334
-
335
-
336
-
337
-
338
-
339
-
340
-
341
-
342
-
343
-
344
-
345
-
346
-
347
-
348
-
349
-
350
-
351
-
352
-
353
-
354
-
355
-
356
-
357
-
358
-
359
-
360
-
361
-
362
-
363
-
364
-
365
-
366
-
367
-
368
-
369
-
370
-
371
-
372
-
373
-
374
-
375
-
376
-
377
-
378
-
379
-
380
-
381
-
382
-
383
-
384
-
385
-
386
-
387
-
388
-
389
-
390
-
391
-
392
-
393
-
394
-
395
-
396
-
397
-
398
-
399
-
400
-
401
-
402
-
403
-
404
-
405
-
406
-
407
-
408
-
409
-
410
-
411
-
412
-
413
-
414
-
415
-
416
-
417
-
418
-
419
-
420
-
421
-
422
-
423
-
424
-
425
-
426
-
427
-
428
-
429
-
430
-
431
-
432
-
433
-
434
-
435
-
436
-
437
-
438
-
439
-
440
-
441
-
442
-
443
-
444
-
445
-
446
-
447
-
448
-
449
-
450
-
451
-
452
-
453
-
454
-
455
-
456
-
457
-
458
-
459
-
460
-
461
-
462
-
463
-
464
-
465
-
466
-
467
-
468
-
469
-
470
-
471
-
472
-
473
-
474
-
475
-
476
 |
 |

HSBC HOLDINGS PLC
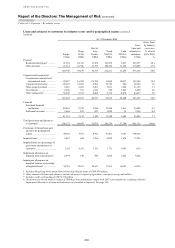
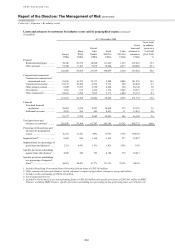
Report of the Directors: The Management of Risk (continued)
Credit risk > Exposure > By industry sector
212
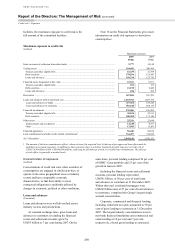
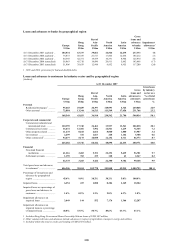
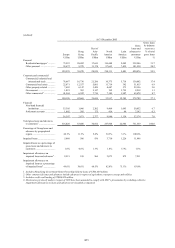
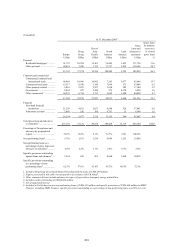
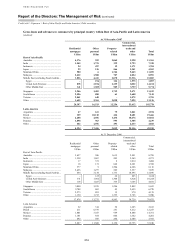
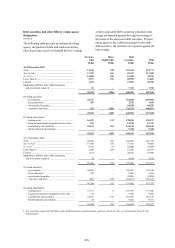
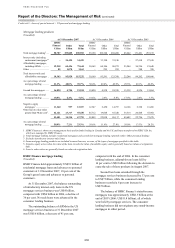
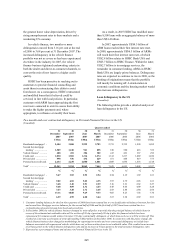
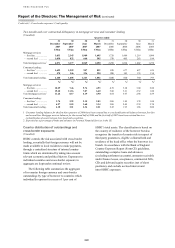
Loans and advances to customers by industry sector and by geographical region (continued)
(Unaudited)
At 31 December 2004
Europe
Hong
Kong
Rest of
Asia-
Pacific
North
America
Latin
America
Gross
loans and
advances to
customers
Gross loans
by industry
sector as a
% of total
gross loans
US$m US$m US$m US$m US$m US$m %
Personal
Residential mortgages1 ........... 70,546 29,373 14,860 111,455 1,613 227,847 33.3
Other personal ........................ 57,920 9,105 9,079 78,984 4,917 160,005 23.3
128,466 38,478 23,939 190,439 6,530 387,852 56.6
Corporate and commercial
Commercial, industrial and
international trade .............. 55,018 14,132 19,177 9,544 4,005 101,876 14.9
Commercial real estate ........... 18,917 10,388 4,232 9,712 220 43,469 6.3
Other property-related ............ 6,850 5,959 3,350 4,266 324 20,749 3.0
Government ............................ 3,663 615 1,432 1,174 3,643 10,527 1.5
Other commercial2................... 34,185 7,294 7,015 5,173 1,484 55,151 8.1
118,633 38,388 35,206 29,869 9,676 231,772 33.8
Financial
Non-bank financial
institutions .......................... 30,901 1,932 2,297 16,624 575 52,329 7.6
Settlement accounts ................ 4,476 596 305 8,431 11 13,819 2.0
35,377 2,528 2,602 25,055 586 66,148 9.6
Total gross loans and
advances to customers3 ........... 282,476 79,394 61,747 245,363 16,792 685,772 100.0
Percentage of Group loans and
advances by geographical
region ...................................... 41.2% 11.6% 9.0% 35.8% 2.4% 100.0%
Impaired loans4,5 .......................... 6,039 696 1,160 3,555 977 12,427
Impaired loans as a percentage of
gross loans and advances4....... 2.1% 0.9% 1.9% 1.4% 5.8% 1.8%
Specific provisions outstanding
against loans and advances5 ... 4,036 320 785 4,106 770 10,017
Specific provisions outstanding
as a percentage of impaired
loans4,5 ..................................... 66.8% 46.0% 67.7% 115.5% 78.8% 80.6%
1 Includes Hong Kong Government Home Ownership Scheme loans of US$5,383 million.
2 Other commercial loans and advances include advances in respect of agriculture, transport, energy and utilities.
3 Includes credit card lending of US$56,222 million.
4 Net of suspended interest.
5 Included in North America are non-performing loans of US$3,020 million and specific provisions of US$3,443 million in HSBC
Finance; excluding HSBC Finance, specific provisions outstanding as a percentage of non-performing loans was 54.6 per cent.