HSBC 2007 Annual Report Download - page 139
Download and view the complete annual report
Please find page 139 of the 2007 HSBC annual report below. You can navigate through the pages in the report by either clicking on the pages listed below, or by using the keyword search tool below to find specific information within the annual report.-
 1
1 -
2
-
3
-
4
-
5
-
6
-
7
-
8
-
9
-
10
-
11
-
12
-
13
-
14
-
15
-
16
-
17
-
18
-
19
-
20
-
21
-
22
-
23
-
24
-
25
-
26
-
27
-
28
-
29
-
30
-
31
-
32
-
33
-
34
-
35
-
36
-
37
-
38
-
39
-
40
-
41
-
42
-
43
-
44
-
45
-
46
-
47
-
48
-
49
-
50
-
51
-
52
-
53
-
54
-
55
-
56
-
57
-
58
-
59
-
60
-
61
-
62
-
63
-
64
-
65
-
66
-
67
-
68
-
69
-
70
-
71
-
72
-
73
-
74
-
75
-
76
-
77
-
78
-
79
-
80
-
81
-
82
-
83
-
84
-
85
-
86
-
87
-
88
-
89
-
90
-
91
-
92
-
93
-
94
-
95
-
96
-
97
-
98
-
99
-
100
-
101
-
102
-
103
-
104
-
105
-
106
-
107
-
108
-
109
-
110
-
111
-
112
-
113
-
114
-
115
-
116
-
117
-
118
-
119
-
120
-
121
-
122
-
123
-
124
-
125
-
126
-
127
-
128
-
 129
129 -
 130
130 -
 131
131 -
 132
132 -
 133
133 -
 134
134 -
 135
135 -
 136
136 -
 137
137 -
 138
138 -
 139
139 -
 140
140 -
 141
141 -
 142
142 -
 143
143 -
 144
144 -
 145
145 -
 146
146 -
 147
147 -
 148
148 -
 149
149 -
150
-
151
-
152
-
153
-
154
-
155
-
156
-
157
-
158
-
159
-
160
-
161
-
162
-
163
-
164
-
165
-
166
-
167
-
168
-
169
-
170
-
171
-
172
-
173
-
174
-
175
-
176
-
177
-
178
-
179
-
180
-
181
-
182
-
183
-
184
-
185
-
186
-
187
-
188
-
189
-
190
-
191
-
192
-
193
-
194
-
195
-
196
-
197
-
198
-
199
-
200
-
201
-
202
-
203
-
204
-
205
-
206
-
207
-
208
-
209
-
210
-
211
-
212
-
213
-
214
-
215
-
216
-
217
-
218
-
219
-
220
-
221
-
222
-
223
-
224
-
225
-
226
-
227
-
228
-
229
-
230
-
231
-
232
-
233
-
234
-
235
-
236
-
237
-
238
-
239
-
240
-
241
-
242
-
243
-
244
-
245
-
246
-
247
-
248
-
249
-
250
-
251
-
252
-
253
-
254
-
255
-
256
-
257
-
258
-
259
-
260
-
261
-
262
-
263
-
264
-
265
-
266
-
267
-
268
-
269
-
270
-
271
-
272
-
273
-
274
-
275
-
276
-
277
-
278
-
279
-
280
-
281
-
282
-
283
-
284
-
285
-
286
-
287
-
288
-
289
-
290
-
291
-
292
-
293
-
294
-
295
-
296
-
297
-
298
-
299
-
300
-
301
-
302
-
303
-
304
-
305
-
306
-
307
-
308
-
309
-
310
-
311
-
312
-
313
-
314
-
315
-
316
-
317
-
318
-
319
-
320
-
321
-
322
-
323
-
324
-
325
-
326
-
327
-
328
-
329
-
330
-
331
-
332
-
333
-
334
-
335
-
336
-
337
-
338
-
339
-
340
-
341
-
342
-
343
-
344
-
345
-
346
-
347
-
348
-
349
-
350
-
351
-
352
-
353
-
354
-
355
-
356
-
357
-
358
-
359
-
360
-
361
-
362
-
363
-
364
-
365
-
366
-
367
-
368
-
369
-
370
-
371
-
372
-
373
-
374
-
375
-
376
-
377
-
378
-
379
-
380
-
381
-
382
-
383
-
384
-
385
-
386
-
387
-
388
-
389
-
390
-
391
-
392
-
393
-
394
-
395
-
396
-
397
-
398
-
399
-
400
-
401
-
402
-
403
-
404
-
405
-
406
-
407
-
408
-
409
-
410
-
411
-
412
-
413
-
414
-
415
-
416
-
417
-
418
-
419
-
420
-
421
-
422
-
423
-
424
-
425
-
426
-
427
-
428
-
429
-
430
-
431
-
432
-
433
-
434
-
435
-
436
-
437
-
438
-
439
-
440
-
441
-
442
-
443
-
444
-
445
-
446
-
447
-
448
-
449
-
450
-
451
-
452
-
453
-
454
-
455
-
456
-
457
-
458
-
459
-
460
-
461
-
462
-
463
-
464
-
465
-
466
-
467
-
468
-
469
-
470
-
471
-
472
-
473
-
474
-
475
-
476
 |
 |
137
Customer Groups, Commercial Banking again
delivered a record performance, as did Private
Banking and Global Banking and Markets, which
made strong progress in the areas in which the
Group has been investing in recent years. Personal
Financial Services declined as growth in Asia and
Latin America was masked by the problems in the
US mortgage services business.
The economic backdrop in 2006 was favourable.
Global equity markets enjoyed strong gains for much
of the year, encouraging expanded investment flows
and creating a receptive marketplace for the high
level of mergers and acquisitions and IPO activity
which followed. However, in these favourable
conditions, the cumulative effect of rising short-term
rates, benign credit conditions and strong liquidity
put pressure on interest margins.
The credit environment for corporate and
commercial lending continued to be exceptionally
good. However, on the back of slowing housing
markets and rising interest rates, a marked
deterioration was experienced in the sub-prime
mortgage market in the US. This more than
outweighed the non-recurrence in 2006 of loan
impairment costs associated with a surge in
bankruptcy filings in the US in the fourth quarter
of 2005, and the effect of hurricane Katrina.
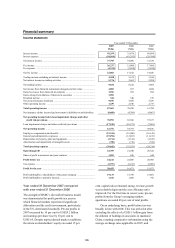
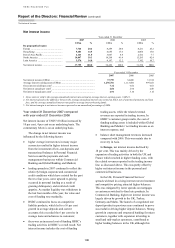
Net operating income before loan impairment
charges and other credit risk provisions of
US$65.4 billion was US$7.7 billion or 13 per cent
higher than in 2005, 11 per cent higher on an
underlying basis. Commercial Banking, Global
Banking and Markets and Private Banking
operations all achieved strong double-digit growth.
Operating income performance was well spread
geographically, with the strongest growth in HSBC’s
operations in Asia and in Latin America.
Loan impairment and other credit risk
provisions, expressed as a percentage of gross
average advances to customers, at 1.4 per cent, were
20 basis points higher in 2006 than the 1.2 per cent
recorded in 2005. There was also a 20 basis point
rise in the ratio of new loan impairment charges to
gross average advances to customers, from 1.4 per
cent in 2005 to 1.6 per cent in 2006. The charge of
US$10.6 billion was US$2.8 billion, or 36 per cent,
higher than in 2005, 30 per cent higher on an
underlying basis. Of this increase, approximately
60 per cent arose in the Group’s Personal Financial
Services businesses in North America, with the
major increase being in the US sub-prime mortgage
portfolio acquired through mortgage services.
Impairment charges in the UK were broadly stable as
a percentage of lending to customers despite a rising
trend of consumer recourse to debt mitigation
arrangements. There was also some credit
deterioration in a few emerging market countries,
notably in the first half of 2006, as a consequence of
regulatory changes.
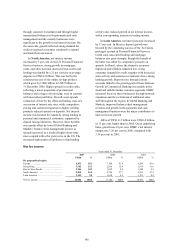
Total operating expenses of US$33.6 billion
were US$4.0 billion or 14 per cent higher than in
2005, 11 per cent higher on an underlying basis.
Much of the growth reflected investment to expand
the Group’s geographic presence and add product
expertise and sales support. This expansion was most
marked in Personal Financial Services in North
America, and in Global Banking and Markets, where
the cost efficiency ratio improved slightly as strong
revenue growth offset the first full year effect of
investment expenditure in previous years.
HSBC’s share of profit in associates and joint
ventures increased by US$202 million, with
improved contributions from The Saudi British
Bank, Bank of Communications and Industrial Bank,
supplemented by a first full year contribution from
Ping An Insurance. HSBC’s share of profits from
investments in associates in Rest of Asia-Pacific
accounted for nearly a quarter of the profits from
that region. For further detailed discussion and
analysis by geographical segment of the Group’s
results see Report of the Directors: Business Review
from page 76.