HSBC 2007 Annual Report Download - page 35
Download and view the complete annual report
Please find page 35 of the 2007 HSBC annual report below. You can navigate through the pages in the report by either clicking on the pages listed below, or by using the keyword search tool below to find specific information within the annual report.-
 1
1 -
2
-
3
-
4
-
5
-
6
-
7
-
8
-
9
-
10
-
11
-
12
-
13
-
14
-
15
-
16
-
17
-
18
-
19
-
20
-
21
-
22
-
23
-
24
-
 25
25 -
 26
26 -
 27
27 -
 28
28 -
 29
29 -
 30
30 -
 31
31 -
 32
32 -
 33
33 -
 34
34 -
 35
35 -
 36
36 -
 37
37 -
 38
38 -
 39
39 -
 40
40 -
 41
41 -
 42
42 -
 43
43 -
 44
44 -
 45
45 -
46
-
47
-
48
-
49
-
50
-
51
-
52
-
53
-
54
-
55
-
56
-
57
-
58
-
59
-
60
-
61
-
62
-
63
-
64
-
65
-
66
-
67
-
68
-
69
-
70
-
71
-
72
-
73
-
74
-
75
-
76
-
77
-
78
-
79
-
80
-
81
-
82
-
83
-
84
-
85
-
86
-
87
-
88
-
89
-
90
-
91
-
92
-
93
-
94
-
95
-
96
-
97
-
98
-
99
-
100
-
101
-
102
-
103
-
104
-
105
-
106
-
107
-
108
-
109
-
110
-
111
-
112
-
113
-
114
-
115
-
116
-
117
-
118
-
119
-
120
-
121
-
122
-
123
-
124
-
125
-
126
-
127
-
128
-
129
-
130
-
131
-
132
-
133
-
134
-
135
-
136
-
137
-
138
-
139
-
140
-
141
-
142
-
143
-
144
-
145
-
146
-
147
-
148
-
149
-
150
-
151
-
152
-
153
-
154
-
155
-
156
-
157
-
158
-
159
-
160
-
161
-
162
-
163
-
164
-
165
-
166
-
167
-
168
-
169
-
170
-
171
-
172
-
173
-
174
-
175
-
176
-
177
-
178
-
179
-
180
-
181
-
182
-
183
-
184
-
185
-
186
-
187
-
188
-
189
-
190
-
191
-
192
-
193
-
194
-
195
-
196
-
197
-
198
-
199
-
200
-
201
-
202
-
203
-
204
-
205
-
206
-
207
-
208
-
209
-
210
-
211
-
212
-
213
-
214
-
215
-
216
-
217
-
218
-
219
-
220
-
221
-
222
-
223
-
224
-
225
-
226
-
227
-
228
-
229
-
230
-
231
-
232
-
233
-
234
-
235
-
236
-
237
-
238
-
239
-
240
-
241
-
242
-
243
-
244
-
245
-
246
-
247
-
248
-
249
-
250
-
251
-
252
-
253
-
254
-
255
-
256
-
257
-
258
-
259
-
260
-
261
-
262
-
263
-
264
-
265
-
266
-
267
-
268
-
269
-
270
-
271
-
272
-
273
-
274
-
275
-
276
-
277
-
278
-
279
-
280
-
281
-
282
-
283
-
284
-
285
-
286
-
287
-
288
-
289
-
290
-
291
-
292
-
293
-
294
-
295
-
296
-
297
-
298
-
299
-
300
-
301
-
302
-
303
-
304
-
305
-
306
-
307
-
308
-
309
-
310
-
311
-
312
-
313
-
314
-
315
-
316
-
317
-
318
-
319
-
320
-
321
-
322
-
323
-
324
-
325
-
326
-
327
-
328
-
329
-
330
-
331
-
332
-
333
-
334
-
335
-
336
-
337
-
338
-
339
-
340
-
341
-
342
-
343
-
344
-
345
-
346
-
347
-
348
-
349
-
350
-
351
-
352
-
353
-
354
-
355
-
356
-
357
-
358
-
359
-
360
-
361
-
362
-
363
-
364
-
365
-
366
-
367
-
368
-
369
-
370
-
371
-
372
-
373
-
374
-
375
-
376
-
377
-
378
-
379
-
380
-
381
-
382
-
383
-
384
-
385
-
386
-
387
-
388
-
389
-
390
-
391
-
392
-
393
-
394
-
395
-
396
-
397
-
398
-
399
-
400
-
401
-
402
-
403
-
404
-
405
-
406
-
407
-
408
-
409
-
410
-
411
-
412
-
413
-
414
-
415
-
416
-
417
-
418
-
419
-
420
-
421
-
422
-
423
-
424
-
425
-
426
-
427
-
428
-
429
-
430
-
431
-
432
-
433
-
434
-
435
-
436
-
437
-
438
-
439
-
440
-
441
-
442
-
443
-
444
-
445
-
446
-
447
-
448
-
449
-
450
-
451
-
452
-
453
-
454
-
455
-
456
-
457
-
458
-
459
-
460
-
461
-
462
-
463
-
464
-
465
-
466
-
467
-
468
-
469
-
470
-
471
-
472
-
473
-
474
-
475
-
476
 |
 |

33
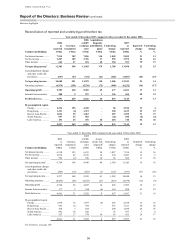
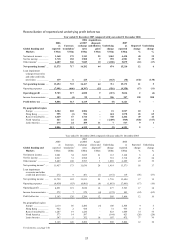
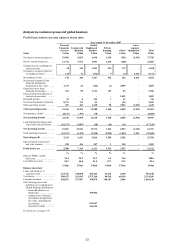
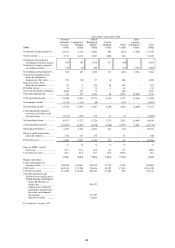
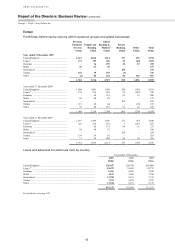
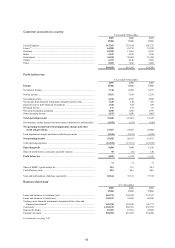
Analysis by customer group and global business
Profit/(loss) before tax and balance sheet data
Year ended 31 December 2007
Total
Personal
Financial
Services
US$m
Commercial
Banking
US$m
Global
Banking &
Markets
US$m
Private
Banking
US$m
Other8
US$m
Inter-
segment
elimination14
US$m
Total
US$m
Net interest income/(expense) .... 29,069 9,055 4,430 1,216 (542) (5,433) 37,795
Net fee income/(expense) ........... 11,742 3,972 4,901 1,615 (228) – 22,002
Trading income excluding net
interest income ....................... 38 265 3,503 525 127 – 4,458
Net interest income/(expense)
on trading activities ................ 140 31 (236) 9 (1) 5,433 5,376
Net trading income5 .................... 178 296 3,267 534 126 5,433 9,834
Net income/(expense) from
financial instruments
designated at fair value ........... 1,333 22 (164) (1) 2,893 – 4,083
Gains less losses from
financial investments .............. 351 90 1,313 119 83 – 1,956
Gains arising from dilution of
interests in associates ............. – – – – 1,092 – 1,092
Dividend income ......................... 55 8 222 7 32 – 324
Net earned insurance premiums . 8,271 733 93 – (21) – 9,076
Other operating income .............. 387 165 1,218 58 3,523 (3,912) 1,439
Total operating income ............ 51,386 14,341 15,280 3,548 6,958 (3,912) 87,601
Net insurance claims6 ................. (8,147) (391) (70) – – – (8,608)
Net operating income4 .............. 43,239 13,950 15,210 3,548 6,958 (3,912) 78,993
Loan impairment charges and
other credit risk provisions ..... (16,172) (1,007) (38) (14) (11) – (17,242)
Net operating income ............... 27,067 12,943 15,172 3,534 6,947 (3,912) 61,751
Total operating expenses ............ (21,757) (6,252) (9,358) (2,025) (3,562) 3,912 (39,042)
Operating profit ........................ 5,310 6,691 5,814 1,509 3,385 – 22,709
Share of profit in associates
and joint ventures ................... 590 454 307 2 150 – 1,503
Profit before tax ........................ 5,900 7,145 6,121 1,511 3,535 – 24,212
% % % % % %
Share of HSBC’s profit
before tax................................. 24.4 29.5 25.3 6.2 14.6 100.0
Cost efficiency ratio ................... 50.3 44.8 61.5 57.1 51.2 49.4
US$m US$m US$m US$m US$m US$m
Balance sheet data7
Loans and advances to
customers (net) ....................... 464,726 220,068 250,464 43,612 2,678 981,548
Total assets .................................. 588,473 261,893 1,375,240 88,510 40,150 2,354,266
Customer accounts ...................... 450,071 237,987 299,879 106,197 2,006 1,096,140
The following assets and
liabilities were significant to
Global Banking and Markets:
– loans and advances to
banks (net) .......................... 199,506
– trading assets, financial
instruments designated at
fair value, and financial
investments ......................... 674,647
– deposits by banks ............... 126,395
For footnotes, see page 130.