HSBC 2007 Annual Report Download - page 50
Download and view the complete annual report
Please find page 50 of the 2007 HSBC annual report below. You can navigate through the pages in the report by either clicking on the pages listed below, or by using the keyword search tool below to find specific information within the annual report.-
 1
1 -
2
-
3
-
4
-
5
-
6
-
7
-
8
-
9
-
10
-
11
-
12
-
13
-
14
-
15
-
16
-
17
-
18
-
19
-
20
-
21
-
22
-
23
-
24
-
25
-
26
-
27
-
28
-
29
-
30
-
31
-
32
-
33
-
34
-
35
-
36
-
37
-
38
-
39
-
 40
40 -
 41
41 -
 42
42 -
 43
43 -
 44
44 -
 45
45 -
 46
46 -
 47
47 -
 48
48 -
 49
49 -
 50
50 -
 51
51 -
 52
52 -
 53
53 -
 54
54 -
 55
55 -
 56
56 -
 57
57 -
 58
58 -
 59
59 -
 60
60 -
61
-
62
-
63
-
64
-
65
-
66
-
67
-
68
-
69
-
70
-
71
-
72
-
73
-
74
-
75
-
76
-
77
-
78
-
79
-
80
-
81
-
82
-
83
-
84
-
85
-
86
-
87
-
88
-
89
-
90
-
91
-
92
-
93
-
94
-
95
-
96
-
97
-
98
-
99
-
100
-
101
-
102
-
103
-
104
-
105
-
106
-
107
-
108
-
109
-
110
-
111
-
112
-
113
-
114
-
115
-
116
-
117
-
118
-
119
-
120
-
121
-
122
-
123
-
124
-
125
-
126
-
127
-
128
-
129
-
130
-
131
-
132
-
133
-
134
-
135
-
136
-
137
-
138
-
139
-
140
-
141
-
142
-
143
-
144
-
145
-
146
-
147
-
148
-
149
-
150
-
151
-
152
-
153
-
154
-
155
-
156
-
157
-
158
-
159
-
160
-
161
-
162
-
163
-
164
-
165
-
166
-
167
-
168
-
169
-
170
-
171
-
172
-
173
-
174
-
175
-
176
-
177
-
178
-
179
-
180
-
181
-
182
-
183
-
184
-
185
-
186
-
187
-
188
-
189
-
190
-
191
-
192
-
193
-
194
-
195
-
196
-
197
-
198
-
199
-
200
-
201
-
202
-
203
-
204
-
205
-
206
-
207
-
208
-
209
-
210
-
211
-
212
-
213
-
214
-
215
-
216
-
217
-
218
-
219
-
220
-
221
-
222
-
223
-
224
-
225
-
226
-
227
-
228
-
229
-
230
-
231
-
232
-
233
-
234
-
235
-
236
-
237
-
238
-
239
-
240
-
241
-
242
-
243
-
244
-
245
-
246
-
247
-
248
-
249
-
250
-
251
-
252
-
253
-
254
-
255
-
256
-
257
-
258
-
259
-
260
-
261
-
262
-
263
-
264
-
265
-
266
-
267
-
268
-
269
-
270
-
271
-
272
-
273
-
274
-
275
-
276
-
277
-
278
-
279
-
280
-
281
-
282
-
283
-
284
-
285
-
286
-
287
-
288
-
289
-
290
-
291
-
292
-
293
-
294
-
295
-
296
-
297
-
298
-
299
-
300
-
301
-
302
-
303
-
304
-
305
-
306
-
307
-
308
-
309
-
310
-
311
-
312
-
313
-
314
-
315
-
316
-
317
-
318
-
319
-
320
-
321
-
322
-
323
-
324
-
325
-
326
-
327
-
328
-
329
-
330
-
331
-
332
-
333
-
334
-
335
-
336
-
337
-
338
-
339
-
340
-
341
-
342
-
343
-
344
-
345
-
346
-
347
-
348
-
349
-
350
-
351
-
352
-
353
-
354
-
355
-
356
-
357
-
358
-
359
-
360
-
361
-
362
-
363
-
364
-
365
-
366
-
367
-
368
-
369
-
370
-
371
-
372
-
373
-
374
-
375
-
376
-
377
-
378
-
379
-
380
-
381
-
382
-
383
-
384
-
385
-
386
-
387
-
388
-
389
-
390
-
391
-
392
-
393
-
394
-
395
-
396
-
397
-
398
-
399
-
400
-
401
-
402
-
403
-
404
-
405
-
406
-
407
-
408
-
409
-
410
-
411
-
412
-
413
-
414
-
415
-
416
-
417
-
418
-
419
-
420
-
421
-
422
-
423
-
424
-
425
-
426
-
427
-
428
-
429
-
430
-
431
-
432
-
433
-
434
-
435
-
436
-
437
-
438
-
439
-
440
-
441
-
442
-
443
-
444
-
445
-
446
-
447
-
448
-
449
-
450
-
451
-
452
-
453
-
454
-
455
-
456
-
457
-
458
-
459
-
460
-
461
-
462
-
463
-
464
-
465
-
466
-
467
-
468
-
469
-
470
-
471
-
472
-
473
-
474
-
475
-
476
 |
 |

HSBC HOLDINGS PLC
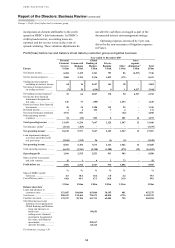
Report of the Directors: Business Review (continued)
Europe > 2007 / 2006
48
low despite balance sheet growth. In Turkey,
increased charges reflected growth in lending
volumes as general credit quality remained
satisfactory.
Excluding Insurance Brokers, operating
expenses increased by 7 per cent. Across Europe,
costs were higher as a result of sales staff
recruitment and other costs to support business
development and expansion, particularly in Turkey
and Eastern Europe. In addition, France incurred
incremental restructuring costs relating to the
migration of IT systems onto HSBC’s core banking
platform.
Global Banking and Markets in Europe
reported a pre-tax profit of US$2.5 billion, broadly
in line with 2006 despite write-downs in credit,
structured credit derivatives and certain positions in
leveraged and acquisition finance, resulting from the
challenging credit market in the second half of 2007.
Apart from these product lines, the Global Markets
and Global Banking businesses reported robust
growth complemented by significant gains on
principal investments. The cost efficiency ratio
deteriorated by 3 percentage points.
Total operating income increased by 7 per cent
to US$7.6 billion. Strong foreign exchange and
equities trading income drove revenue growth,
enhanced by higher advisory fees and fair value
gains in financing and capital markets. Securities
services benefited from higher transaction volumes
driven by increased market volatility. A rise in
revenues from payments and cash management and
principal investments further boosted income. This
growth was partly offset by significant write-downs
in credit and structured derivatives.
In the UK, payments and cash management
income grew due to higher customer balances, which
rose as the liquidity crisis led customers to increase
their cash balances. In Turkey, higher balance sheet
management revenues contributed US$12 million.
Net fee income was 28 per cent higher, with
robust growth in income from financing businesses
in line with greater market activity in the UK and
France in the first half of 2007. In securities services,
a rise in volumes and new client mandates drove the
increase in revenues. Assets under custody grew by
16 per cent.
Overall, income from trading activities fell due
to US$713 million of write-downs reported in credit,
structured credit derivatives and leveraged and
acquisition finance in the UK. These were partly
offset by strong growth in foreign exchange driven
by market volatility and a weakening US dollar. In
equities, strong trading income from core products
was supplemented by a gain from the sale of
Euronext shares. In France, the continuing trend of
higher income from structured derivatives reflected
the benefit of investment to enhance capabilities.
The credit market dislocation also led to an adverse
fair value adjustment in respect of loan commitments
outstanding when global credit spreads widened in
the second half of 2007.
The UK principal investments business
benefited a small number of significant realisations
during the year. Gains less losses from financial
investments rose to US$1.1 billion.
A net recovery on loan impairment charges,
albeit lower than in 2006, reflected the continued
low level of corporate credit defaults.
Operating expenses rose by 12 per cent to
US$5.2 billion. Operational costs rose in Global
Markets, particularly in structured derivatives where
the French businesses invested to support local
revenue growth. Costs also rose in payments and
cash management and securities services, driven by
the rise in business volumes. Additional staff costs
resulted from recruitment in selected businesses
during 2006.
HSBC’s share of profits from associates
recovered due to the non-recurrence of an
impairment charge on a private equity investment
held by an associate in 2006.
Private Banking reported a pre-tax profit of
US$915 million, an increase of 11 per cent. A strong
performance in Switzerland was driven by the
promotion of advisory and discretionary mandates,
with existing clients further leveraging their
portfolios. Profits in the UK declined as a result of
lower gains from the partial disposal of the
Hermitage Fund. Excluding this transaction, UK
revenue increased strongly. The cost-efficiency ratio
increased slightly by 0.9 percentage points to
56.9 per cent, affected by lower investment gains in
2007. Despite this, the cost efficiency ratio is one of
the strongest in the industry.
Net interest income rose by 14 per cent to
US$793 million. Switzerland contributed the
majority of the increase. Loans and advances
to customers increased by 31 per cent to
US$13.8 billion, as existing clients further leveraged
their portfolios to take advantage of alternative
investment opportunities. Monaco and Germany
also contributed to the rise in net interest income.
In Germany, net interest income increased by 14 per
cent due to a large growth in deposits. Similarly, in
Monaco, customer accounts rose, augmented by