HSBC 2007 Annual Report Download - page 164
Download and view the complete annual report
Please find page 164 of the 2007 HSBC annual report below. You can navigate through the pages in the report by either clicking on the pages listed below, or by using the keyword search tool below to find specific information within the annual report.-
 1
1 -
2
-
3
-
4
-
5
-
6
-
7
-
8
-
9
-
10
-
11
-
12
-
13
-
14
-
15
-
16
-
17
-
18
-
19
-
20
-
21
-
22
-
23
-
24
-
25
-
26
-
27
-
28
-
29
-
30
-
31
-
32
-
33
-
34
-
35
-
36
-
37
-
38
-
39
-
40
-
41
-
42
-
43
-
44
-
45
-
46
-
47
-
48
-
49
-
50
-
51
-
52
-
53
-
54
-
55
-
56
-
57
-
58
-
59
-
60
-
61
-
62
-
63
-
64
-
65
-
66
-
67
-
68
-
69
-
70
-
71
-
72
-
73
-
74
-
75
-
76
-
77
-
78
-
79
-
80
-
81
-
82
-
83
-
84
-
85
-
86
-
87
-
88
-
89
-
90
-
91
-
92
-
93
-
94
-
95
-
96
-
97
-
98
-
99
-
100
-
101
-
102
-
103
-
104
-
105
-
106
-
107
-
108
-
109
-
110
-
111
-
112
-
113
-
114
-
115
-
116
-
117
-
118
-
119
-
120
-
121
-
122
-
123
-
124
-
125
-
126
-
127
-
128
-
129
-
130
-
131
-
132
-
133
-
134
-
135
-
136
-
137
-
138
-
139
-
140
-
141
-
142
-
143
-
144
-
145
-
146
-
147
-
148
-
149
-
150
-
151
-
152
-
153
-
 154
154 -
 155
155 -
 156
156 -
 157
157 -
 158
158 -
 159
159 -
 160
160 -
 161
161 -
 162
162 -
 163
163 -
 164
164 -
 165
165 -
 166
166 -
 167
167 -
 168
168 -
 169
169 -
 170
170 -
 171
171 -
 172
172 -
 173
173 -
 174
174 -
175
-
176
-
177
-
178
-
179
-
180
-
181
-
182
-
183
-
184
-
185
-
186
-
187
-
188
-
189
-
190
-
191
-
192
-
193
-
194
-
195
-
196
-
197
-
198
-
199
-
200
-
201
-
202
-
203
-
204
-
205
-
206
-
207
-
208
-
209
-
210
-
211
-
212
-
213
-
214
-
215
-
216
-
217
-
218
-
219
-
220
-
221
-
222
-
223
-
224
-
225
-
226
-
227
-
228
-
229
-
230
-
231
-
232
-
233
-
234
-
235
-
236
-
237
-
238
-
239
-
240
-
241
-
242
-
243
-
244
-
245
-
246
-
247
-
248
-
249
-
250
-
251
-
252
-
253
-
254
-
255
-
256
-
257
-
258
-
259
-
260
-
261
-
262
-
263
-
264
-
265
-
266
-
267
-
268
-
269
-
270
-
271
-
272
-
273
-
274
-
275
-
276
-
277
-
278
-
279
-
280
-
281
-
282
-
283
-
284
-
285
-
286
-
287
-
288
-
289
-
290
-
291
-
292
-
293
-
294
-
295
-
296
-
297
-
298
-
299
-
300
-
301
-
302
-
303
-
304
-
305
-
306
-
307
-
308
-
309
-
310
-
311
-
312
-
313
-
314
-
315
-
316
-
317
-
318
-
319
-
320
-
321
-
322
-
323
-
324
-
325
-
326
-
327
-
328
-
329
-
330
-
331
-
332
-
333
-
334
-
335
-
336
-
337
-
338
-
339
-
340
-
341
-
342
-
343
-
344
-
345
-
346
-
347
-
348
-
349
-
350
-
351
-
352
-
353
-
354
-
355
-
356
-
357
-
358
-
359
-
360
-
361
-
362
-
363
-
364
-
365
-
366
-
367
-
368
-
369
-
370
-
371
-
372
-
373
-
374
-
375
-
376
-
377
-
378
-
379
-
380
-
381
-
382
-
383
-
384
-
385
-
386
-
387
-
388
-
389
-
390
-
391
-
392
-
393
-
394
-
395
-
396
-
397
-
398
-
399
-
400
-
401
-
402
-
403
-
404
-
405
-
406
-
407
-
408
-
409
-
410
-
411
-
412
-
413
-
414
-
415
-
416
-
417
-
418
-
419
-
420
-
421
-
422
-
423
-
424
-
425
-
426
-
427
-
428
-
429
-
430
-
431
-
432
-
433
-
434
-
435
-
436
-
437
-
438
-
439
-
440
-
441
-
442
-
443
-
444
-
445
-
446
-
447
-
448
-
449
-
450
-
451
-
452
-
453
-
454
-
455
-
456
-
457
-
458
-
459
-
460
-
461
-
462
-
463
-
464
-
465
-
466
-
467
-
468
-
469
-
470
-
471
-
472
-
473
-
474
-
475
-
476
 |
 |

HSBC HOLDINGS PLC
Report of the Directors: Financial Review (continued)
FUM / Assets held in custody and under administration / Economic profit
162
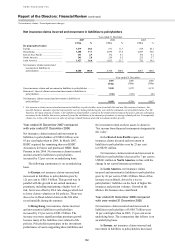
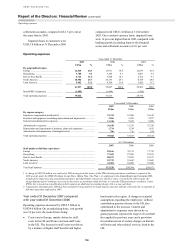
to a small extent, held to maturity. The available for
sale investments essentially represent a core element
of the Group’s liquidity and may be disposed of
either to manage that liquidity or in response to
investment opportunities arising from favourable
movements in economic indicators, such as interest
rates, foreign exchange rates and equity prices. They
are carried at fair value with unrealised gains and
losses from movements thereon reported in equity
until disposal. On disposal the accumulated
unrealised gain or loss is recognised through the
income statement and reported as ‘Gains less losses
from financial investments’.
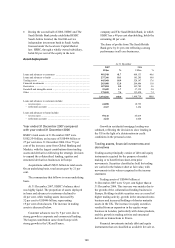
Financial investments were 29 per cent higher
than reported at 31 December 2006, excluding the
effect of acquisitions, chiefly HSBC Assurances.
This was mainly due to the decision to consolidate
Cullinan Finance Ltd (‘Cullinan’) and Asscher
Finance Ltd (‘Asscher’), two structured investment
vehicles managed by HSBC. The continued growth
of HSBC’s operations in emerging markets also led
to increased holdings of debt securities as surplus
funds were invested and more assets were needed to
meet regulatory requirements. Net unrealised gains in
the valuation of equities amounted to US$4.2 billion.
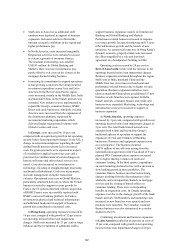
Derivatives are financial instruments that derive
their value from the price of an underlying item.
HSBC transacts derivatives for three primary
purposes: to create risk management solutions for
clients, for proprietary trading purposes, and to
manage and hedge HSBC’s own risks.
Derivative assets rose by 73 per cent, due to
increases in interest rate swap balances, primarily
in the UK and France. Credit derivative assets
increased, particularly in the US in the first half of
the year, followed by a significant slowdown in
client trading in the second half of the year due to
the deterioration in credit markets. Foreign exchange
derivative balances increased, driven by heightened
volatility in major currencies, particularly the
US dollar.
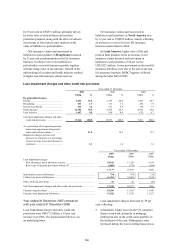
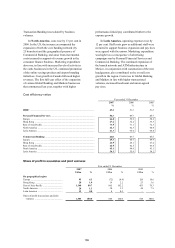
Funds under management
2007 2006
US$bn US$bn
Funds under management
At 1 January ............................... 695 561
Net new money .......................... 36 44
Value change ............................. 53 57
Exchange and other ................... 60 33
At 31 December ......................... 844 695
Year ended 31 December
2007 2006
US$bn US$bn
Funds under management by
business
HSBC Global Asset
Management .......................... 380 328
Private Banking ......................... 275 232
Affiliates .................................... 3 2
Other ........................................... 186 133
844 695
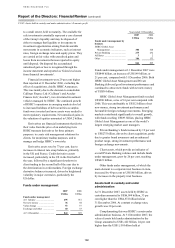
Funds under management at 31 December 2007 were
US$844 billion, an increase of US$149 billion, or
21 per cent, compared with 31 December 2006. Both
HSBC Global Asset Management and Private
Banking delivered good investment performance and
continued to attract new funds with net new money
of US$36 billion.
HSBC Global Asset Management funds reached
US$380 billion, a rise of 16 per cent compared with
2006. This was attributable to US$12 billion of net
new money, strong investment performance and
favourable foreign exchange movements. Emerging
markets contributed significantly to overall growth,
with funds reaching US$93 billion, placing HSBC
Global Asset Management as one of the world’s
largest emerging market asset managers.
Private Banking’s funds increased by 19 per cent
to US$275 billion, driven by client acquisition, partly
due to greater brand awareness and an enhanced
product range, strong investment performance and
foreign exchange movements.
Client assets, which provide an indicator of
overall Private Banking volumes and include funds
under management, grew by 26 per cent, reaching
US$421 billion.
Other funds under management, of which the
main element is a corporate trust business in Asia,
increased by 40 per cent to US$186 billion, driven
by increases in the property trust business.
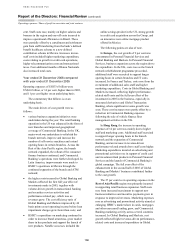
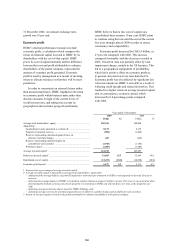
Assets held in custody and under
administration
At 31 December 2007, assets held by HSBC as
custodian amounted to US$6,094 billion, 33 per
cent higher than the US$4,572 billion held at
31 December 2006. At constant exchange rates,
growth was 30 per cent.
Complementing this was HSBC’s assets under
administration business. At 31 December 2007, the
value of assets held under administration by the
Group amounted to US$1,422 billion, 24 per cent
higher than the US$1,150 billion held at