Xerox 2014 Annual Report Download - page 92
Download and view the complete annual report
Please find page 92 of the 2014 Xerox annual report below. You can navigate through the pages in the report by either clicking on the pages listed below, or by using the keyword search tool below to find specific information within the annual report.-
 1
1 -
2
-
3
-
4
-
5
-
6
-
7
-
8
-
9
-
10
-
11
-
12
-
13
-
14
-
15
-
16
-
17
-
18
-
19
-
20
-
21
-
22
-
23
-
24
-
25
-
26
-
27
-
28
-
29
-
30
-
31
-
32
-
33
-
34
-
35
-
36
-
37
-
38
-
39
-
40
-
41
-
42
-
43
-
44
-
45
-
46
-
47
-
48
-
49
-
50
-
51
-
52
-
53
-
54
-
55
-
56
-
57
-
58
-
59
-
60
-
61
-
62
-
63
-
64
-
65
-
66
-
67
-
68
-
69
-
70
-
71
-
72
-
73
-
74
-
75
-
76
-
77
-
78
-
79
-
80
-
81
-
 82
82 -
 83
83 -
 84
84 -
 85
85 -
 86
86 -
 87
87 -
 88
88 -
 89
89 -
 90
90 -
 91
91 -
 92
92 -
 93
93 -
 94
94 -
 95
95 -
 96
96 -
 97
97 -
 98
98 -
 99
99 -
 100
100 -
 101
101 -
 102
102 -
103
-
104
-
105
-
106
-
107
-
108
-
109
-
110
-
111
-
112
-
113
-
114
-
115
-
116
-
117
-
118
-
119
-
120
-
121
-
122
-
123
-
124
-
125
-
126
-
127
-
128
-
129
-
130
-
131
-
132
-
133
-
134
-
135
-
136
-
137
-
138
-
139
-
140
-
141
-
142
-
143
-
144
-
145
-
146
-
147
-
148
-
149
-
150
-
151
-
152
 |
 |

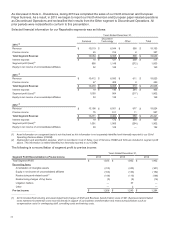
As discussed in Note 4 - Divestitures, during 2013 we completed the sales of our North American and European
Paper business. As a result, in 2013 we began to report our North American and European paper-related operations
as Discontinued Operations and reclassified their results from the Other segment to Discontinued Operations. All
prior periods were reclassified to conform to this presentation.
Selected financial information for our Reportable segments was as follows:
Years Ended December 31,
Services
Document
Technology Other Total
2014 (1)
Revenue $10,519 $8,044 $590 $19,153
Finance income 65 314 8 387
Total Segment Revenue $10,584 $8,358 $598 $19,540
Interest expense $ 18 $ 121 $238 $377
Segment profit (loss)(2) 956 1,149 (272)1,833
Equity in net income of unconsolidated affiliates 32 128 — 160
2013 (1)
Revenue $10,412 $8,500 $611 $19,523
Finance income 67 408 8 483
Total Segment Revenue $10,479 $8,908 $619 $20,006
Interest expense $ 19 $ 140 $244 $403
Segment profit (loss)(2) 1,055 964 (217)1,802
Equity in net income of unconsolidated affiliates 34 135 — 169
2012 (1)
Revenue $10,196 $8,951 $677 $19,824
Finance income 75 511 11 597
Total Segment Revenue $10,271 $9,462 $688 $20,421
Interest expense $ 19 $ 172 $236 $427
Segment profit (loss)(2) 1,091 1,065 (254)1,902
Equity in net income of unconsolidated affiliates 30 122 — 152
____________________________
(1) Asset information on a segment basis is not disclosed as this information is not separately identified and internally reported to our Chief
Operating Decision Maker (CODM).
(2) Depreciation and amortization expense, which is recorded in Cost of Sales, Cost of Services, RD&E and SAG are included in segment profit
above. This information is neither identified nor internally reported to our CODM.
The following is a reconciliation of segment profit to pre-tax income:
Years Ended December 31,
Segment Profit Reconciliation to Pre-tax Income 2014 2013 2012
Total Segment Profit $1,833 $1,802 $1,902
Reconciling items:
Amortization of intangible assets (315)(305)(301)
Equity in net income of unconsolidated affiliates (160)(169)(152)
Restructuring and related costs(1) (149)(115)(149)
Restructuring charges of Fuji Xerox (3) (9) (16)
Litigation matters —37—
Other —2—
Pre-tax Income $1,206 $1,243 $1,284
____________________________
(1) 2014 includes Restructuring and asset impairment charges of $128 and Business transformation costs of $21. Business transformation
costs represent incremental costs incurred directly in support of our business transformation and restructuring initiatives such as
compensation costs for overlapping staff, consulting costs and training costs.
77